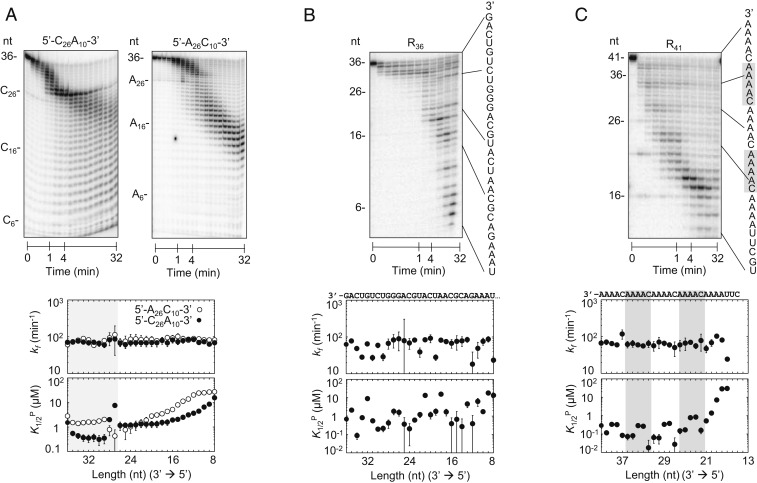
Fig. 4.
Degradation of substrates with increasing sequence diversity. (A, Upper) Representative degradation reactions of 5′-C26A10-3′ (1 nM; Rrp6p, 110 nM) and 5′-A26C10-3′ (1 nM; Rrp6p, 110 nM). (A, Lower) kinetic parameters for the degradation of 5′-C26A10-3′ (solid circles) and 5′-A26C10-3′ (open circles) for individual nucleotides (Upper plot, degradation rate constant (kf); Lower plot, apparent dissociation constant for productive binding (K1/2P). Data show results of the global data fits, and error bars mark the SEs of the global fits. Shading indicates the transition between A and C sequence blocks. (B, Upper) Representative degradation reactions of a 36-mer RNA (R36,1 nM; Rrp6p, 110 nM) with mixed sequence (indicated on the right). (B, Lower) Kinetic parameters for the degradation of R36, as in A. (C, Upper) Representative degradation reactions of a 41-mer RNA (R41,1 nM; Rrp6p, 110 nM) with mixed sequence, including four 3′-A4C-5′ repeats (sequence indicated on the right). (C, Lower) Kinetic parameters for the degradation of R41, as in A. Shading indicates the 3′-A4C-5′ repeats.

