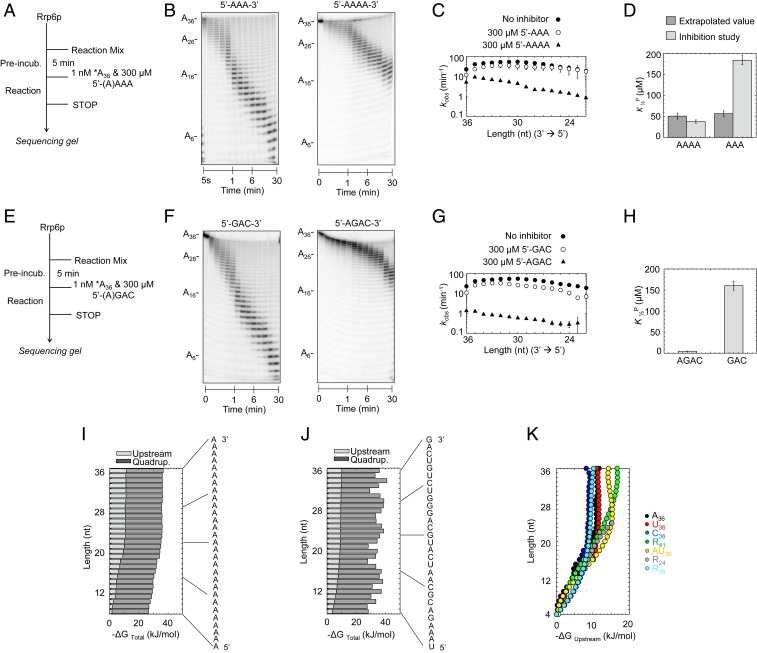
Fig. 5.
Deconvolution of RNA length and sequence effects on Rrp6p activity. (A) Reaction scheme for competition experiments. (B) Representative competition reactions of A3 (300 μM; A36, 1 nM; Rrp6p, 220 nM) and A4 (300 μM; A36, 1 nM; Rrp6p, 220 nM). (C) Observed rate constants (kobs) for the degradation of A36 at single-nucleotide resolution in the absence (solid circles) and presence of A3 (open circles) and A4 (triangles), under conditions noted in A. Datapoints represent an average of 3 independent measurements. Error bars show one SD. (D) Apparent dissociation constants for productive binding (K1/2P) of A3 and A4 obtained experimentally and calculated values assuming similar scaling of inhibition by A3 and A4 (SI Appendix, Fig. S6). (E) Reaction scheme for competition experiments. (F) Representative competition reactions of 5′-GAC-3′ (300 μM; A36, 1 nM; Rrp6p, 220 nM) and 5′-AGAC-3′ (300 μM; A36, 1 nM; Rrp6p, 220 nM). (G) Observed rate constants (kobs) for the degradation of A36 at single-nucleotide resolution in the absence (solid circles) and presence of 5′-GAC-3′ (open circles) and 5′-AGAC-3′ (triangles), under conditions noted in E. Datapoints represent an average of 3 independent measurements. Error bars show one SD. (H) Apparent dissociation constants for binding of 5′-GAC-3′ and 5′-AGAC-3′ obtained from competitive inhibition experiments. (I) Contributions of upstream RNA (light gray) and 3′-terminal quadruplet (dark gray) to free binding energy for productive binding for each nucleotide for A36. (J) Contributions of upstream RNA (light gray) and 3′-terminal quadruplet (dark gray) to free binding energy for productive binding for each nucleotide for R36 (sequence on the right). (K) Contributions of the upstream RNA component to free binding energy for productive binding for each nucleotide for substrates indicated on the right.

