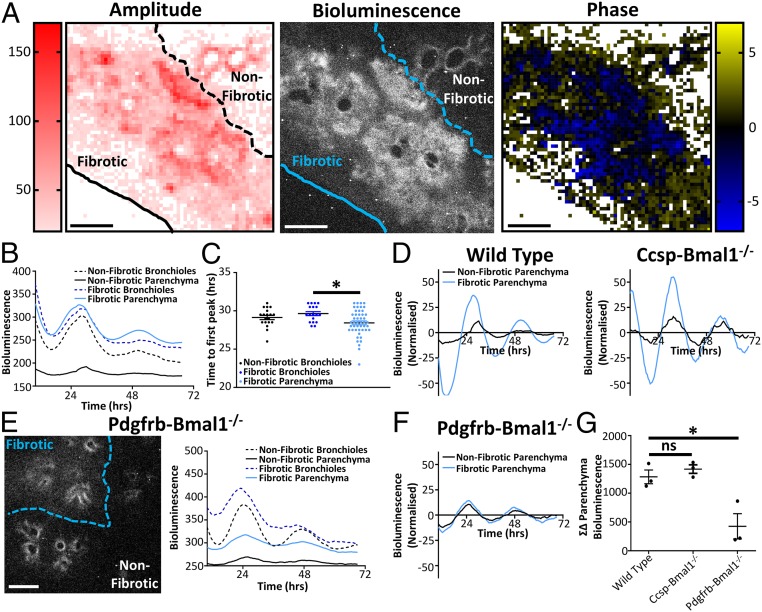
Fig. 1.
Asynchronous circadian oscillations occur in pulmonary fibrosis. (A) Bioluminescent image along with heat maps of amplitude and phase taken from the same PCLS obtained from a mPER2::luc mouse 14 d after in vivo bleomycin treatment (3 U/kg). Data are representative of 3 separate experiments. (Scale bars, 500 µm.) (B) Bioluminescent intensity plotted against time for both parenchyma and bronchioles in fibrotic and nonfibrotic regions (data are representative of 3 separate experiments). (C) Time to first peak for bronchioles and parenchyma in fibrotic and nonfibrotic areas. *P < 0.05 (ANOVA with post hoc Dunnett test using 18, 19, and 48 representative sections for healthy airways, fibrotic airways, and fibrotic parenchyma, respectively, in the lung slice). Data are representative of 3 separate experiments (mean ± SEM). (D) Bioluminescent intensity plotted against time (24-h moving average baseline subtracted) for the representative slices shown in A and Ccsp-Bmal1−/− mice shown in SI Appendix, Fig. S2A. (E) Representative bioluminescent image along with bioluminescent intensity plotted against time for a PCLS 14 d after in vivo bleomycin treatment in the Pdgfrb-Bmal1−/− mPER2::luc mouse (3 U/kg). Data are representative of 3 separate experiments. (Scale bar, 500 µm.) (F) Bioluminescent intensity plotted against time (24-h moving average baseline subtracted) for the Pdgfrb-Bmal1−/− representative slice shown in E. (G) Difference in bioluminescence between fibrotic and nonfibrotic parenchyma over 3 d in PCLS from WT, Ccsp-Bmal1−/−, and Pdgfrb-Bmal1−/− mice after in vivo bleomycin treatment (n = 3 animals). ns, not significant. *P < 0.05 (1-way ANOVA Dunnett post hoc test; mean ± SEM).

