Fig. 3.
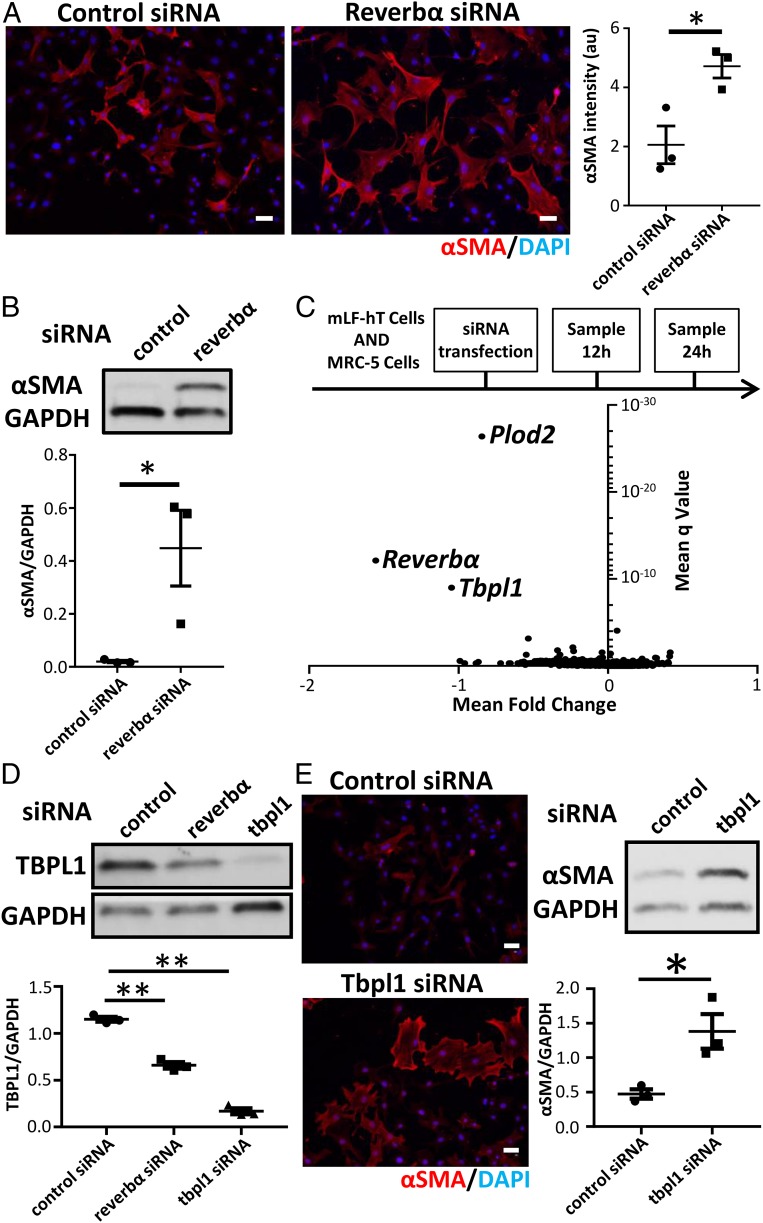
REVERBα alters myofibroblast differentiation via TBPL1. (A) Immunofluorescent staining and quantification for the myofibroblast marker αSMA after control (nontargeting) or Reverbα siRNA knockdown in mLF-hT cells (n = 3 separate transfections). *P < 0.05 (Student t test; mean ± SEM). (Scale bars, 50 µm.) (B) Immunoblot and densitometry for αSMA in MRC-5 cells after control (nontargeting) or REVERBα siRNA knockdown (representative immunoblot shown; n = 3 separate transfections). *P < 0.05 (Student t test; mean ± SEM). (C) Schematic of RNA-seq sample preparation. Control (nontargeting) or Reverbα siRNA knockdown was performed in 2 fibroblast cell lines (mLF-hT cells and MRC-5). Samples were collected for RNA-seq analysis 12 and 24 h after siRNA transfection from 3 separate transfections for each cell line per time point. Pooled analysis of all 4 different RNA-seq experimental conditions is shown by a volcano plot (mean fold change plotted against mean q-value). (D) Immunoblot of TBPL1 following control (nontargeting) or Reverbα or Tbpl1 siRNA knockdown in mLF-hT cells (a representative immunoblot is shown; n = 3 separate transfections). **P < 0.01 (Student t test; mean ± SEM). (E) Representative immunofluorescence and immunoblotting for αSMA after control (nontargeting) or Tbpl1 siRNA knockdown in mLF-hT cells (a representative immunoblot is shown; n = 3 separate transfections). *P < 0.05 (Student t test; mean ± SEM). (Scale bars, 50 µm.) DAPI, 4′,6-diamidino-2-phenylindole.

