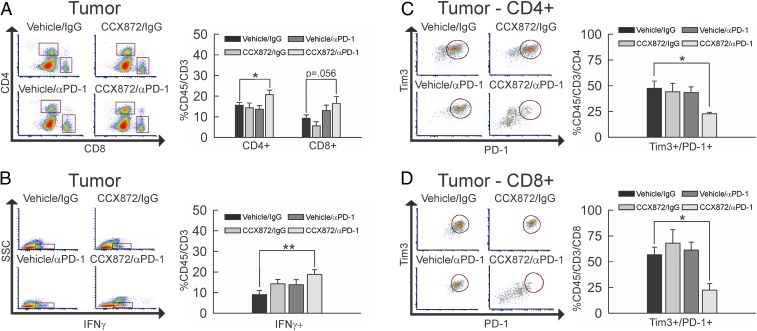
Fig. 6.
Impact of combinatorial CCX872/anti-PD-1 treatment on CD4+ and CD8+ T cells. (A) Flow-cytometric analysis of CD45+/CD3+/CD4+ and CD8+ events within tumor extracts from vehicle/IgG-treated (n = 7), CCX872/IgG-treated (n = 4), vehicle/anti-PD-1–treated (n = 6), or CCX872/anti-PD-1–treated (n = 4) 005 GSC glioma-bearing mice. The population of CD45+/CD3+/CD4+ cells (upper square) was significantly increased (P = 0.044) with combination CCX872/anti-PD-1 treatment as compared to vehicle/IgG, while the CD45+/CD3+/CD8+ population (lower square) trended toward increase (P = 0.056) between the same groups. (B) Flow-cytometric analysis of side scatter (SSC) vs. CD45+/CD3+/IFNγ+ events (denoted by square) within tumor extracts from vehicle/IgG-treated (n = 7), CCX872/IgG-treated (n = 4), vehicle/anti-PD-1–treated (n = 5), or CCX872/anti-PD-1–treated (n = 6) 005 GSC glioma-bearing mice. The population of CD45+/CD3+/IFNγ+ cells was significantly increased (P = 0.008) with combination CCX872/anti-PD-1 treatment as compared to vehicle/IgG. (C and D) Flow-cytometric analysis of CD45+/CD3+/PD-1+/Tim3+/CD4+ (C) and CD8+ (D) events within tumor extracts from vehicle/IgG-treated (n = 7), CCX872/IgG-treated (n = 4), vehicle/anti-PD-1–treated (n = 6), or CCX872/anti-PD-1–treated (n = 4) 005 GSC glioma-bearing mice. The population of CD45+/CD3+/PD-1+/Tim3+/CD4+ cells (circled population) was significantly decreased (P = 0.029) with combination CCX872/anti-PD-1 treatment as compared to vehicle/IgG. The population of CD45+/CD3+/PD-1+/Tim3+/CD8+ cells (circled population) also decreased (P = 0.011) between the same groups. Representative plots are shown throughout. *P < 0.05; **P < 0.01.

