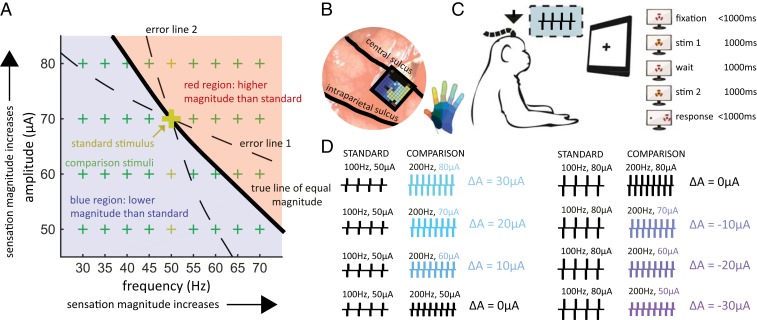
Fig. 1.
Experimental design. (A) Frequency/amplitude trade-off in perceived magnitude, illustrated with the stimuli used with a 50-Hz standard frequency. Each point on the surface represents a pair of stimulation parameters. Sensation magnitude increases with both frequency and amplitude. The thick black line describes stimuli whose sensory magnitude is equal to that of a 50-Hz, 70-µA stimulus (large gold +). In theory, the standard stimulus could then be paired with other comparison stimuli on the line and the animals could not discriminate frequency based on differences in magnitude. However, if the estimate of this line is incorrect (dashed lines), then the animals can still make frequency judgments based on differences in magnitude: Following error line 1, every comparison frequency greater than the standard frequency will feel more intense and every comparison frequency lower than the standard will feel less intense. The inverse is true for error line 2. As the relative contributions of frequency and amplitude to intensity vary across electrodes, characterizing the isointensity contour is challenging. The alternative approach is to present stimuli that tile the frequency and amplitude space (green +s), so that the magnitude of the higher-frequency stimulus is sometimes higher and sometimes lower than that of the lower-frequency stimulus. Reliance on magnitude will lead to poor overall performance and lower rewards. The separation between the blue and red regions will shift if the standard frequency is presented at other amplitudes (small gold +s). (B) A Utah electrode array (UEA) was implanted in the hand representation of area 1 (the implant of monkey C is shown). (C) The animal faced a monitor that signaled the trial sequence (shown on the right, red markers denote the gaze). The animal maintained fixation on a central target while 2 ICMS pulse trains were sequentially delivered and then reported its frequency judgment by making a saccade to one of 2 targets. The animal was rewarded if it selected the pulse train with the higher frequency (regardless of stimulus amplitude). (D) Example of standard-comparison frequency pair (not all amplitude combinations shown). Colors denote the difference in amplitude between the comparison and the standard stimulus. The largest amplitude difference was ±30 µA.

