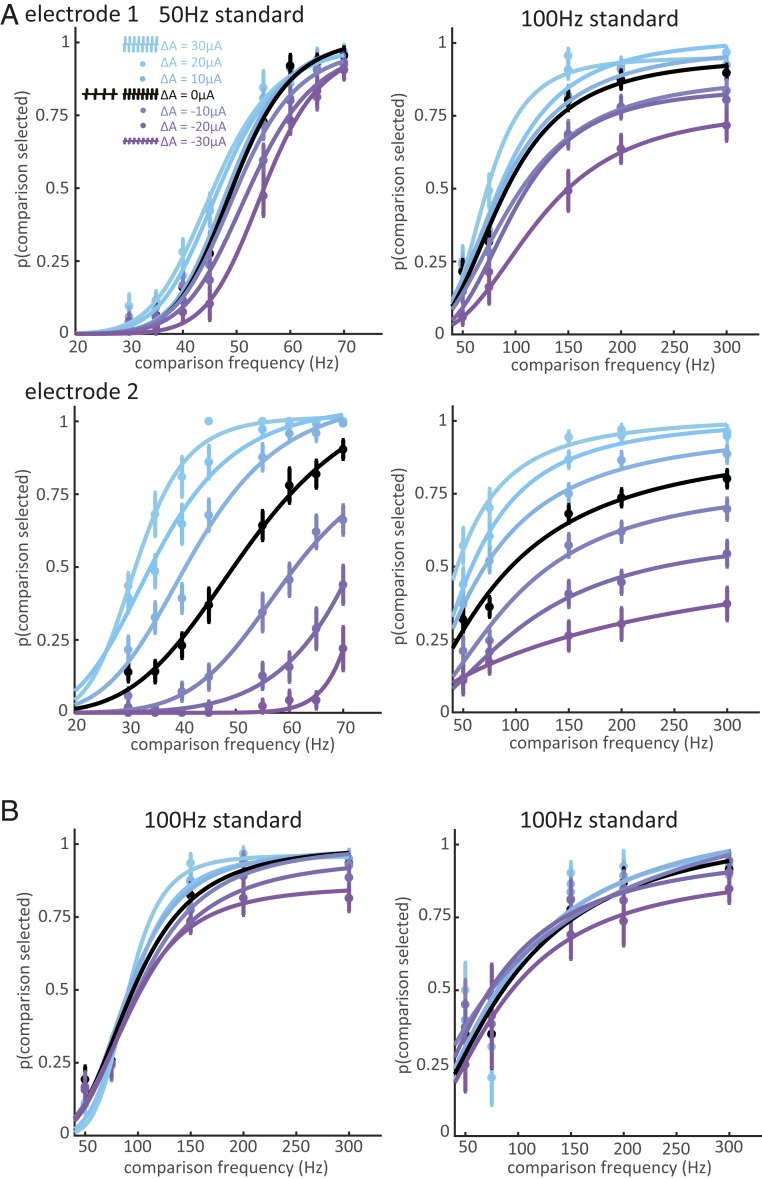
Fig. 3.
Frequency discrimination with unequal amplitudes. (A, Top) Behavioral performance at one electrode from monkey A for standard frequencies of 50 and 100 Hz. Colors indicate amplitude differences between the comparison and standard frequencies (blue indicates the comparison stimulus amplitude was higher and purple indicates it was lower). The animal’s choices were slightly biased toward the higher amplitude. (A, Bottom) The same monkey’s performance for a different electrode. The monkey could perform frequency discrimination with equal amplitudes at both electrodes (black), but amplitude exerted a powerful influence on its frequency judgments when stimulation was delivered through this electrode. Error bars show the SEM across training blocks. (B) Behavioral performance on one low-bias electrode in monkey B (Left) and one in monkey C (Right).

