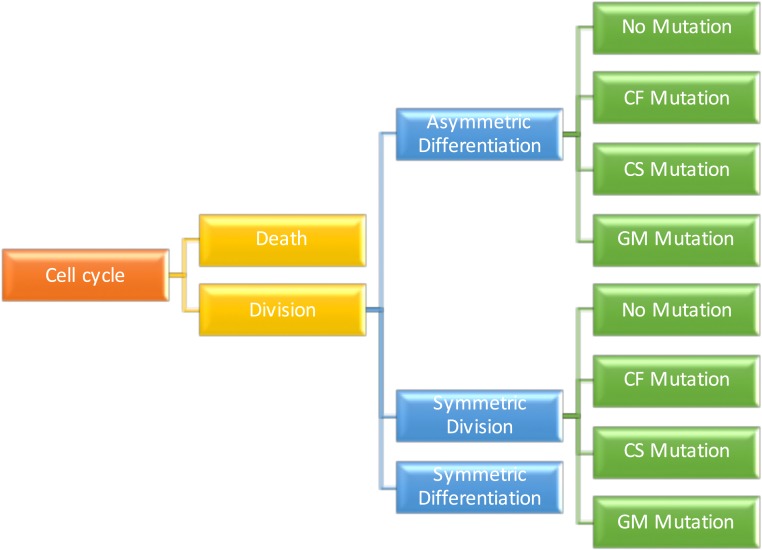
Fig. 1.
Visualization of the model’s transition rules as a tree. Each node of the graph represents a possible event, and each edge has an associated probability or rate of occurrence, as described in SI Appendix. Three types of mutations are considered, depending on the affected cell function: cell fate (CF), cell survival (CS), and genome maintenance (GM), as described in the main text as well as in figure 7 and table S5 of ref. 9 for a comprehensive list.

