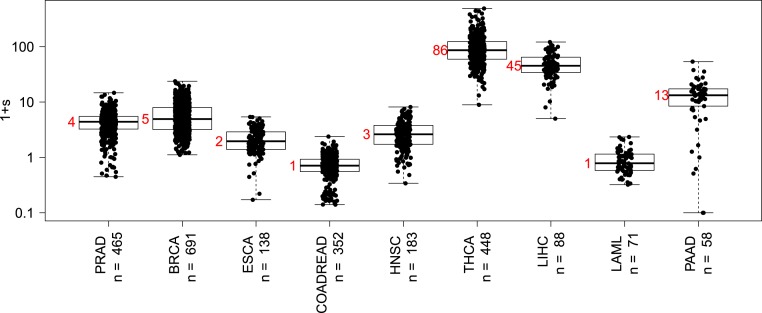
Fig. 2.
Distributions of the fitness advantage, , caused by cell survival driver mutations across cancer types. The median value (red) is approximated by the nearest integer. Cancer types are labeled according to The Cancer Genome Atlas (TCGA) nomenclature (BRCA, breast invasive carcinoma; COADREAD, colorectal adenocarcinoma; ESCA, esophageal carcinoma; HNSC, head and neck squamous cell carcinoma; LAML, acute myeloid leukemia; LIHC, liver hepatocellular carcinoma; PAAD, pancreatic adenocarcinoma; PRAD, prostate adenocarcinoma; THCA, thyroid carcinoma).

