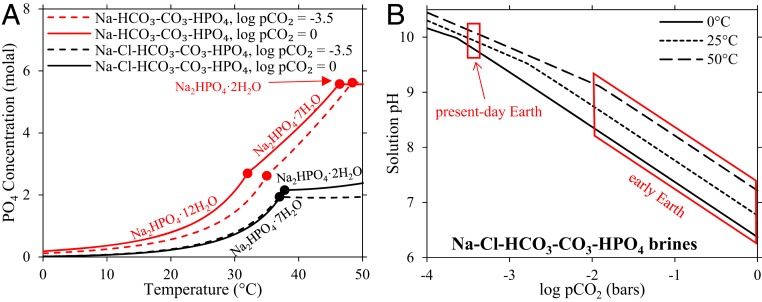
Fig. 3.
Phosphate concentrations and pH modeled in saturated, carbonate-rich lake brines. (A) The concentration of phosphate in solutions saturated with respect to sodium phosphate. The red lines indicate the solubility of pure Na2HPO4·XH2O, where XH2O refers to the hydration state (X = 2, 7, and 12). The black lines indicate the solubility of sodium phosphate in solutions saturated with respect to sodium phosphate, chloride, and carbonate salts. Solid lines are for 1 bar atmospheric pCO2, and dashed lines are for log pCO2 = −3.5 bar (the pCO2 of present-day Earth). (B) The pH of solutions saturated with respect to sodium phosphate, chloride, and carbonate salts at variable temperature and pCO2. The range of pH and temperature of these solutions encompasses that of the black lines in A.

