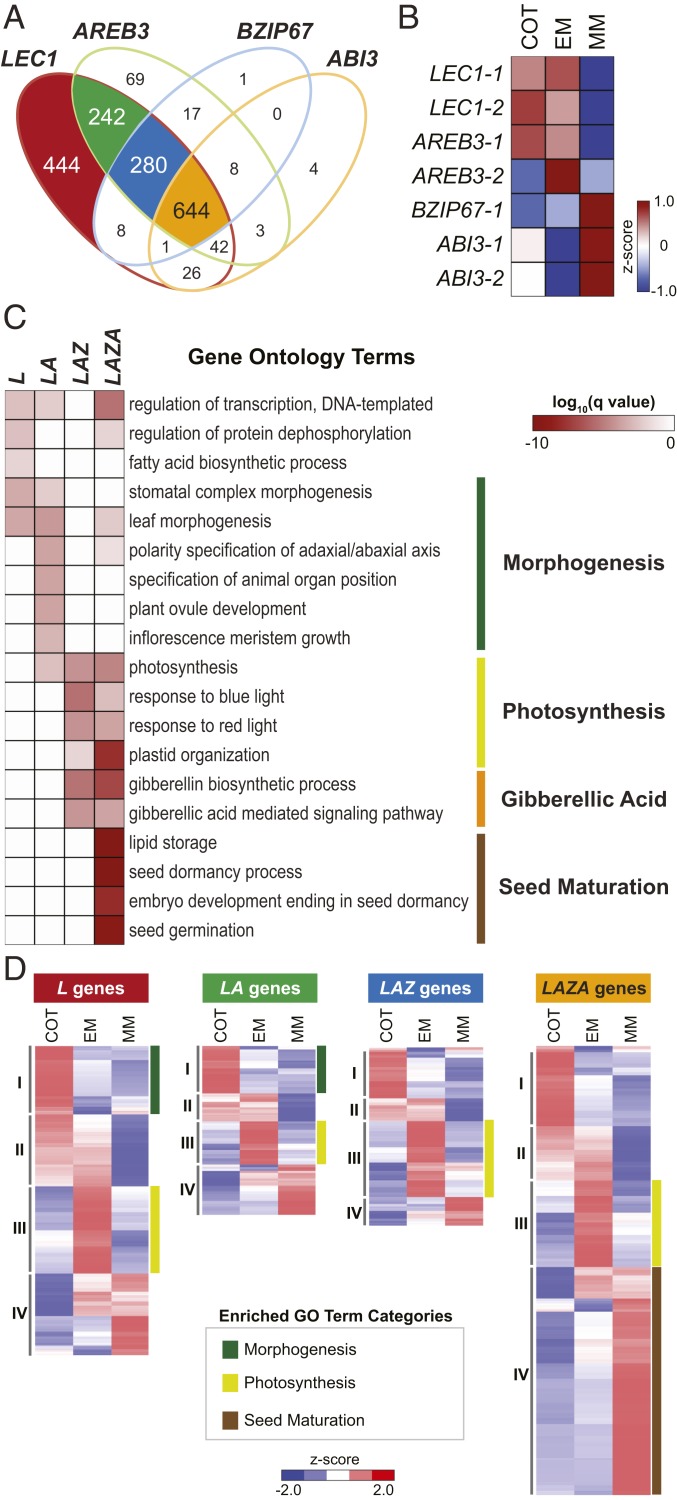
Fig. 2.
Overlap between LEC1, AREB3, bZIP67, and ABI3 target genes indicate combinatorial interactions among transcription factors. (A) Venn diagram showing the overlap between LEC1, AREB3, bZIP67, and ABI3 target genes. Four major groups were identified: genes targeted by LEC1 (L genes, red); genes targeted by LEC1 and AREB3 (LA genes, green); genes targeted by LEC1, AREB3, and bZIP67 (LAZ genes, blue); and genes targeted by LEC1, AREB3, bZIP67, and ABI3 (LAZA genes, orange). Gene lists are given in Dataset S3. (B) LEC1, AREB3, bZIP67, and ABI3 mRNA accumulation in soybean embryos at the COT, EM, and MM stages. mRNA levels were obtained from the Harada Embryo mRNA-Seq Dataset (GEO accession no. GSE99571, ref. 79). (C) Heatmap shows the q value significance of GO terms for L, LA, LAZ, and LAZA gene sets. GO terms listed are the top 5 most enriched biological process GO terms for each gene set. A comprehensive list of overrepresented GO terms is given in Dataset S1. (D) Hierarchical clustering of L, LA, LAZ, and LAZA gene sets. Heatmaps show relative embryo mRNA levels at the COT, EM, and MM stages. The major enriched developmental processes associated with each cluster are indicated. Gene lists and GO term enrichments for each cluster are given in Dataset S3.

