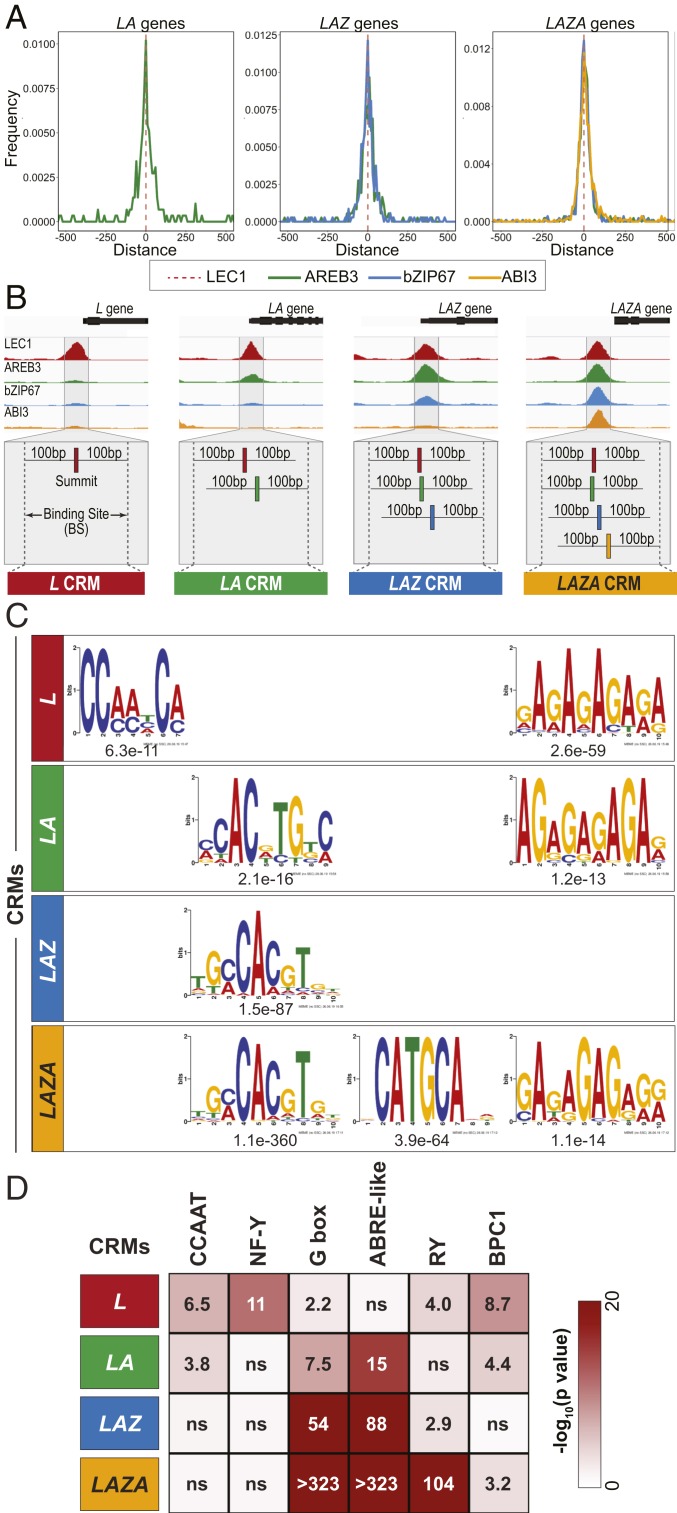
Fig. 3.
Clustered binding sites for LEC1, AREB3, bZIP67, and ABI3 define cis-regulatory modules. (A) Distance between the positions of the ChIP peak summits of AREB3 (green), bZIP67 (blue), and ABI3 (yellow) and the LEC1 ChIP peak summit (dotted red line) for LA, LAZ, and LAZA genes. (B) Diagrammatic representation of the strategy used to define CRMs. (B, Upper) Genome browser representation of ChIP-Seq reads for LEC1 (red), AREB3 (green), bZIP67 (blue), and ABI3 (yellow) in the upstream genomic regions of L (Glyma.13G031500), LA (Glyma.08G106400), LAZ (Glyma.01G057700), and LAZA (Glyma.01G186200) genes. (B, Lower) CRMs are defined as the genomic region whose boundaries extend 100 bp beyond the terminal ChIP peak summits of a cluster. LA, LAZ, and LAZA CRMs were computed by merging the binding sites of 1) LEC1 and AREB3; 2) LEC1, AREB3, and bZIP67; and 3) LEC1, AREB3, bZIP67, and ABI3, respectively. L CRMs were defined as LEC1 binding sites of L genes. CRM genomic coordinates are listed in Dataset S4. (C) Position weight matrices of DNA sequence motifs discovered de novo in L, LA, LAZ, and LAZA CRMs and their relative enrichment as indicated by their associated E values. De novo discovered motifs and DNA motifs in the Arabidopsis DAP-Seq (67) or Human HOCOMOCOv11 (80) databases most closely related to the discovered motifs are listed in Dataset S4. (D) DNA motif enrichment in CRM regions. Heatmaps depict the statistical significance of the enrichment of annotated DNA motifs most closely related to de novo discovered motifs in L, LA, LAZ, and LAZA CRM regions, relative to the normal distribution of a population of randomly generated regions. Bonferroni-adjusted P values are listed, with a significance threshold of 0.01, with ns denoting no significant difference. Frequencies at which DNA motifs were identified in CRMs are shown in SI Appendix, Fig. S7.

