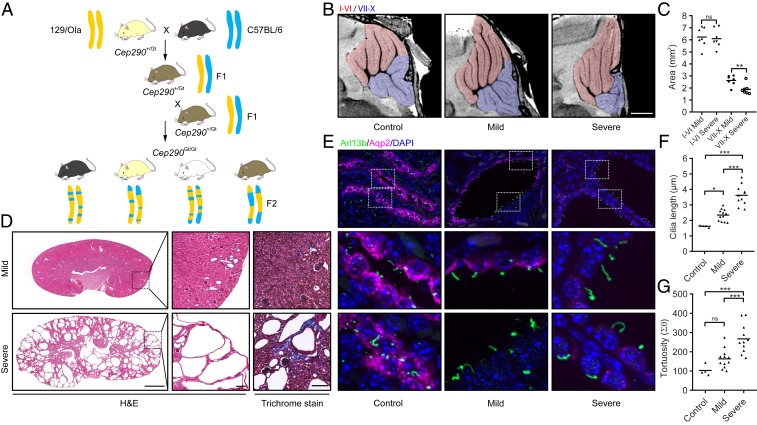
Fig. 1.
Phenotypic spectrum of an F2 Cep290Gt/Gt mouse model of Joubert syndrome. (A) Schematic showing mouse breeding strategy. Cep290Gt/+ heterozygous mice on a 129/Ola background were bred with wild-type C57BL/6 mice to generate F1 hybrids. F1 Cep290Gt/+ heterozygous mice were then interbred to give F2 Cep290Gt/Gt homozygous animals with a randomized set of alleles from both parent strains. Representative alleles from 129/Ola and C57BL/6 mice are shown in yellow and blue, respectively. Variable coat colors in F2 mice from this cross are shown including black, chinchilla, albino, and agouti (Left to Right). (B) High-resolution ex vivo MRI showing morphologically aberrant cerebellar structures in P21 F2 Cep290Gt/Gt mice. A subset of F2 Cep290Gt/Gt mice shows localized aplasia within the cerebellum, specifically within the folium–tuber vermis, pyramus, uvula, and nodulus (lobules VII to X, respectively; blue overlay). Lobules I to VI appear largely unaffected (red overlay); flattening of the cerebellum against the skull can be observed in all Cep290Gt/Gt animals as a result of hydrocephalus. Representative images of wild-type control, mild, and severe animals are shown. (Scale bar, 1 mm.) (C) Quantification of the sagittal cross-sectional area of lobules I to VI compared with VII to X of the cerebellum in mild and severe F2 Cep290Gt/Gt animals (Student’s t test, **P < 0.01; ns, not significant). (D) Hematoxylin and eosin (H&E) and Masson’s Trichrome images of kidneys from F2 Cep290Gt/Gt mice showing a large degree of phenotypic heterogeneity in terms of the number and size of cysts, as well as the amount of interstitial fibrosis as indicated by increased collagen deposition (blue staining). (Scale bars, 1 mm [main images] and 100 μm [expanded views].) (E) Immunofluorescence staining of P21 mouse kidney from F2 Cep290+/+ and Cep290Gt/Gt animals, showing the expression of the ciliary GTPase Arl13b (green) and the water channel Aquaporin 2 (Aqp2; magenta). The 2 Lower in each column are magnified regions from the Upper identified by dotted boxes. (Scale bars, 10 μm.) (F and G) Quantification of cilia length (F) and tortuosity (G) in F2 Cep290+/+ and Cep290Gt/Gt animals (1-way ANOVA, *P < 0.05, **P < 0.01, ***P < 0.001).

