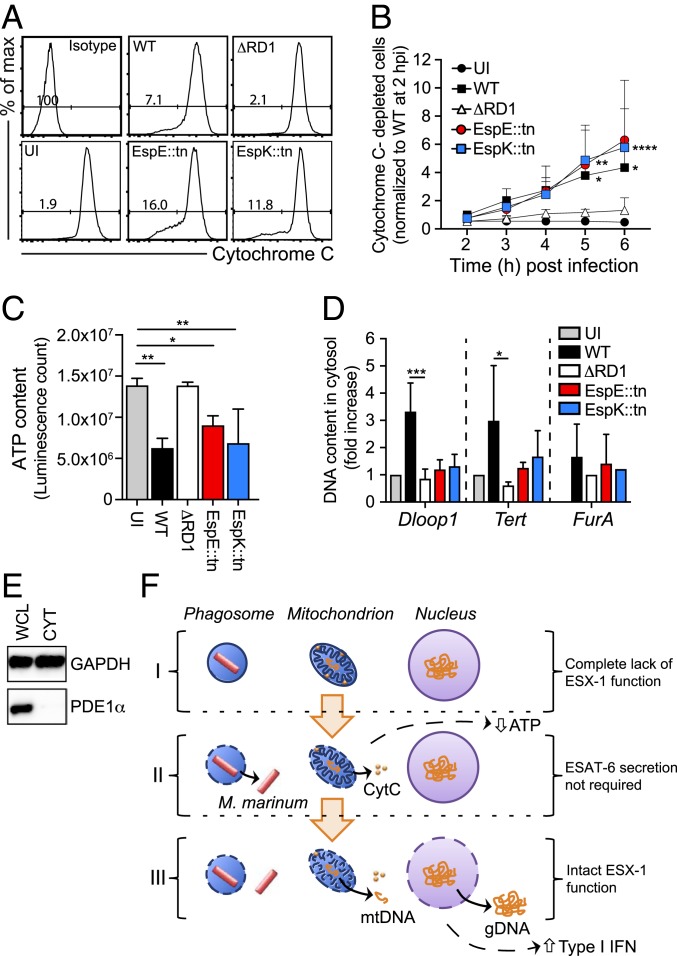
Fig. 4.
ESX-1–dependent disruption of mitochondrial integrity and cytosolic DNA release are genetically separate mechanisms. (A and B) Macrophages were infected as indicated at MOI = 15, and kinetic experiments of Cytochrome C (CytC) release were performed by flow cytometry. An isotype IgG antibody and UI cells were analyzed as controls. (A) The histogram plots show the cell counts (y axis) and the fluorescence intensity (x axis) as well as the percentage of cells negative for CytC-staining, i.e., cells with CytC depletion, at 6 hpi. (B) The graph represents the fold increase of CytC-depleted cells. Data normalized to WT M. marinum at 2 hpi. Results (mean + SD) from 4 independent experiments (2-way ANOVA, *P < 0.05, **P < 0.01, ****P < 0.0001). (C) Macrophages were infected as indicated at MOI = 15, and total ATP was measured at 24 hpi using a luminescent assay. Results (mean + SD) from 3 independent experiments (one-way ANOVA, *P < 0.05, **P < 0.01). (D) Macrophages were infected as indicated at MOI = 5. UI cells were analyzed as control. The presence of mitochondrial (Dloop1), nuclear (Tert), or mycobacterial (FurA) DNA in the cytosolic compartment was evaluated by qPCR at 24 hpi. Results (mean + SD) from 3 independent experiments (one-way ANOVA, *P < 0.05, ***P < 0.001). (E) The mitochondrial protein puryvate dehydrogenase E1 alpha (PDE1α) was analyzed in whole cell lysates (WCL) and cytosolic fractions (CYT) by Western blot. GAPDH was used as a loading control. Shown is 1 experiment representative of 2. (F) Schematic representation illustrating that M. marinum infection of macrophages can be separated into at least 3 distinct stages (I–III) based on an incremental need for ESX-1 functionality. Genomic (gDNA) and mitochondrial (mtDNA) DNA, as indicated.

