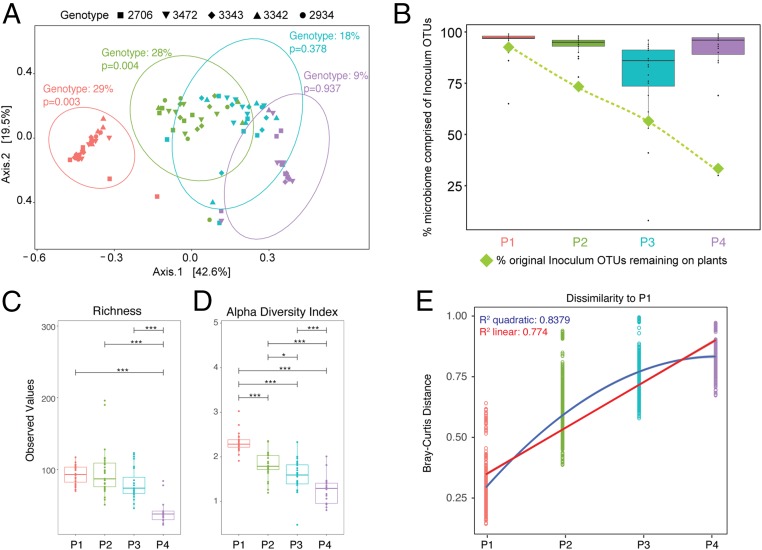
Fig. 2.
Bacterial community change over time. (A) Principal coordinates analysis (PCoA) plot of Bray–Curtis dissimilarity among samples shows a significant effect of genotype in P1 and P2 (determined by PERMANOVA tests). Ellipses indicate 95% confidence around the clustering. (B) The percent of original inoculum OTUs present at each passage was calculated (green diamonds), and the reads/sample of inoculum OTUs out of total reads was calculated for each plant at every passage and displayed on a box plot. (C and D) Plots of richness (C) and Shannon’s alpha diversity index (D) at each passage show a significant decrease over time. (E) Bray–Curtis dissimilarities between microbiomes in P1 were compared to those in P1, P2, P3, and P4, and linear and quadratic models were fit to the data. Corrected P values for multiple pairwise comparisons in C and D are indicated on the graph. *P ≤ 0.05; ***P ≤ 0.001.

