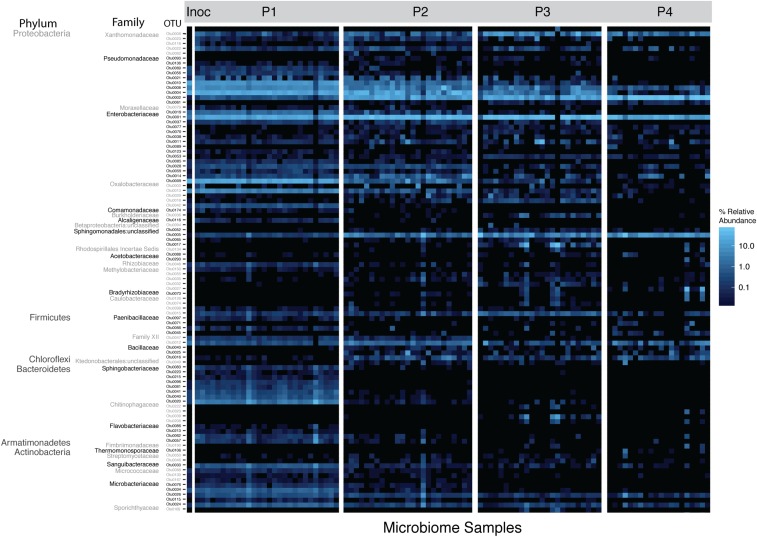
Fig. 3.
Changing relative abundance of top 100 OTUs. A heat map showing relative abundance of the top 100 OTUs illustrates the changing community composition at multiple taxonomic levels. Full taxonomy of OTUs is found in SI Appendix, Table S1. Inoc, inoculum.

