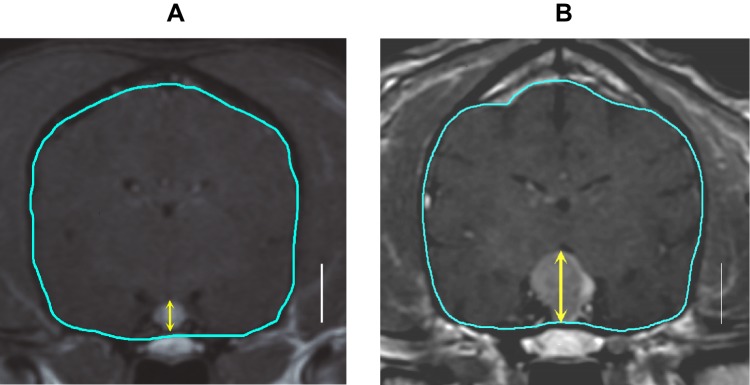
Figure 4.
Measurements of pituitary brain ratio (PBR). PBR can be calculated by both CT and MRI. Among Gd-enhanced T1 weighted transverse images, the image that contained the largest cross section of the pituitary was selected. For the brain area, the edge of the brain were traced on the display (shown in blue line), and the enclosed area was calculated. On the same image, the height of the pituitary gland was measured (shown in yellow arrow). A vertical bar in both figures represent 10 mm. The PBR was calculated according to the following formula: PBR = (height of the pituitary gland)/(cross sectional area of the brain) x 102. This was advocated by Dr. Kooistra HS in1997.41 (A) T1-weighted transverse image of the healthy dog. The brain area, pituitary height, and PBR were 1608mm2, 4.7mm, and 0.292, respectively. (B) T1-weighted transverse image of the dog with pituitary tumor. The brain area, pituitary height, and PBR were 1650mm2, 11.4mm, and 0.691, respectively.

