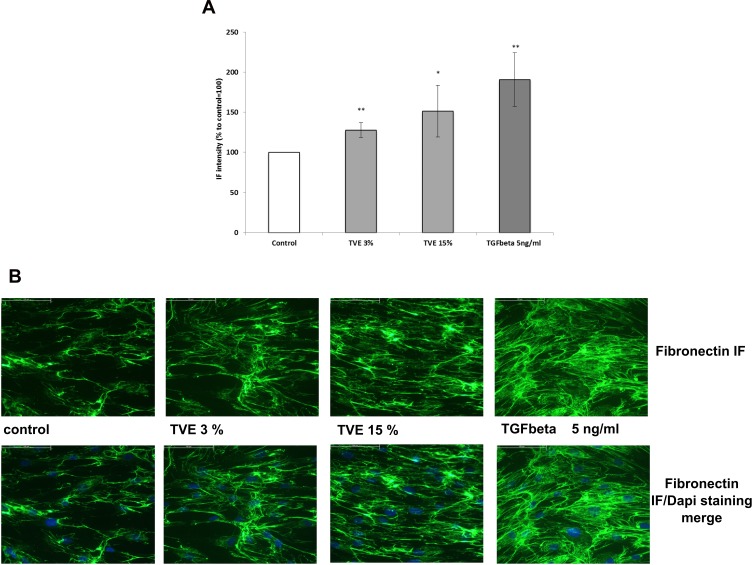
Figure 3.
Effect of TVE on Fibronectin protein localization. HDF were treated with TVE at the indicated concentrations and after 72 h they were processed for immunofluorescence analysis. In the panel A, it was reported the fluorescence quantification corresponding to fibronectin production. The results are the averages of three independent experiments, expressed as percentages respect to the untreated control, arbitrarily set as 100%. The error bars represent standard deviations, and the asterisks indicate statistically significant values (** p value is between 0.001 to 0.01; *0.01 to 0.05). In the panel B, they were reported representative pictures for each treatment.

