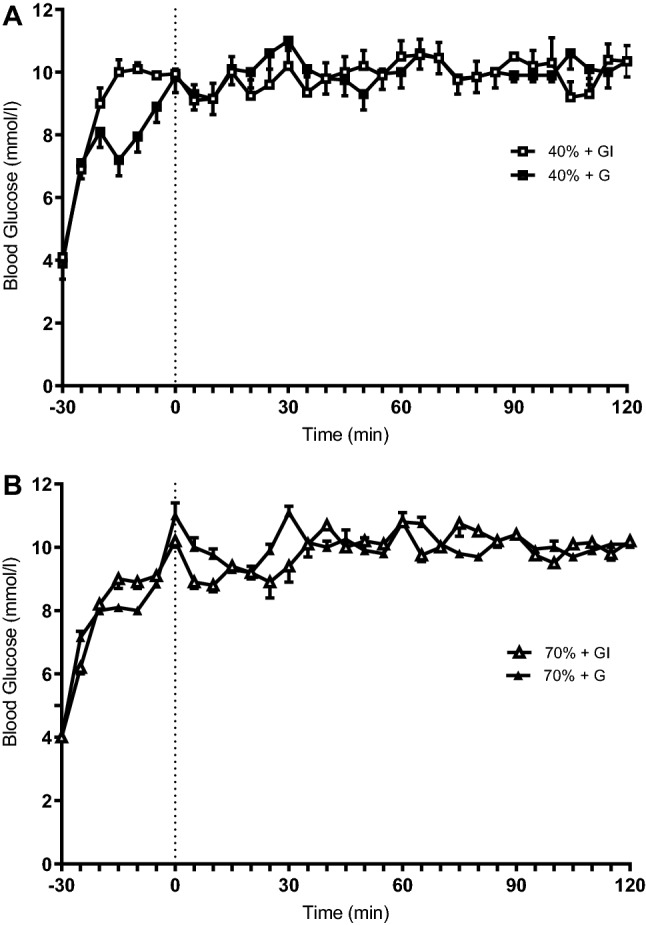
Fig. 2.

Blood glucose concentrations at rest (− 30), after prime infusion (0), and during 120 min of cycling at 40% VO2max (a) and 70% VO2max (b)

Blood glucose concentrations at rest (− 30), after prime infusion (0), and during 120 min of cycling at 40% VO2max (a) and 70% VO2max (b)