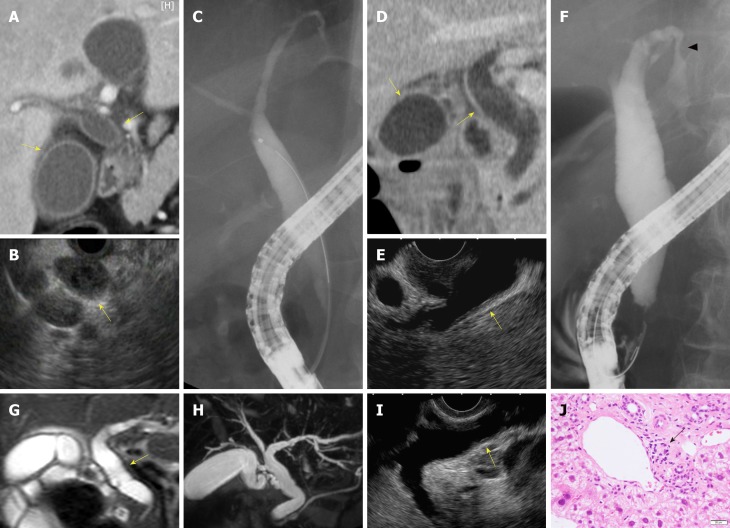
Figure 2.
Our cases with sclerosing cholangitis caused by nivolumab (Case 29, A–C; Case 30, D–F; Case 31, G–J). A, D: Computed tomography; G, H: Magnetic resonance imaging; B, E, I: Endoscopic ultrasonography. Revealed diffuse hypertrophy of biliary tract (yellow allows) in all cases. C, F: Endoscopic retrograde cholangiopancreatography revealed biliary stenosis of the intrahepatic bile duct (arrow-head) in Case 30. J: In Case 31, liver biopsy showed lymphocyte infiltration in Glisson’s capsule (black arrow).

