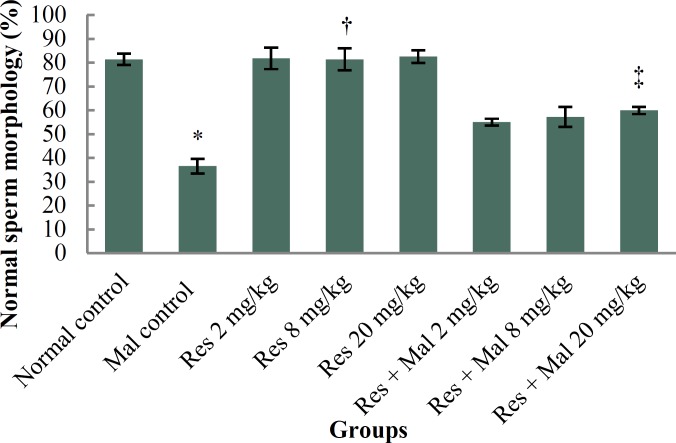
Figure 1.
Comparison of normal sperm cell morphology in treatment groups.
*Significant increase compared to the normal control group (p < 0.001). †Significant increase compared to the Malathion control group (p < 0.001). ‡Significant increase compared to the Malathion control group (p < 0.001). Rse, Resveratrol; Mal, Malathion.

