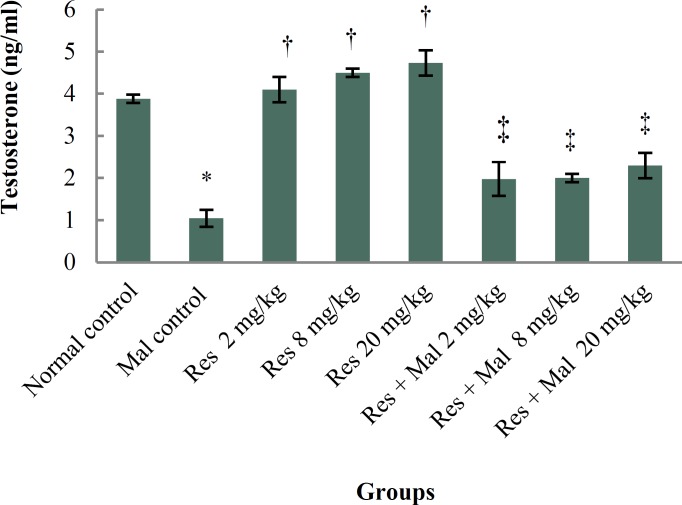
Figure 4.
Comparison of testosterone hormone level in treatment groups.
*Significant decrease compared to the normal control group (p < 0.001). † Significant increase compared to the Malathion control group (p < 0.001). ‡Significant increase compared to the Malathion control group (p < 0.001). Rse, Resveratrol; Mal, Malathion.

