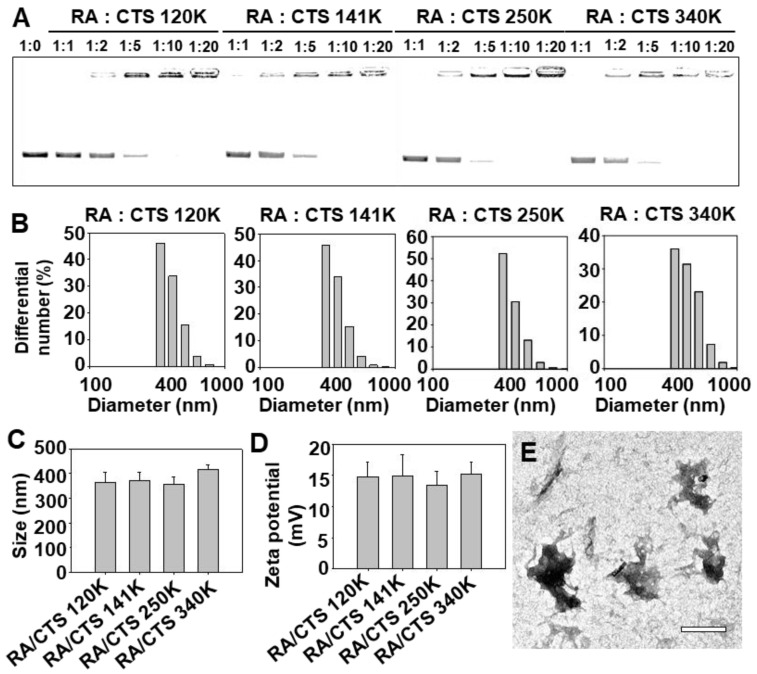
Figure 2.
Characterization of RA/CTS polyplexes. (A) Polyplex formation between RA and CTS at various weight ratios was tested by gel retardation assay on agarose gels. Size distribution (B) and mean size (C) of RA/CTS polyplexes formulated with CTS at various molecular weights were measured by dynamic light scattering. (D) Zeta potentials were obtained from RA/CTS polyplexes formed at various CTS molecular weights. (E) Morphology of RA/CTS polyplexes using CTS 340 kDa (1:10, w/w), observed by TEM imaging. Scale bar, 500 nm.

