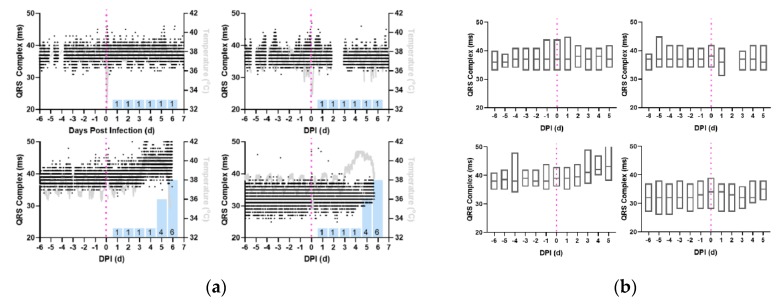
Figure 2.
Increase in QRS complex during the febrile period in macaques with severe EEEV. Shown are the profiles (a) of QRS complex derived from 1-min average measurements for four individual macaques infected with EEEV. Black: QRS Complex (ms), Gray: Temperature (°C), and Magenta: aerosol challenge. Blue Bars: Neurological score on corresponding day. (b) Average daily QRS complex measurements, from repeated measures ANOVA, depicted in with boxes delimited by interquartile range and center line signifying median value. For (a) and (b), Top Left: M160-16, Bottom Left: M161-16, Top Right: M162-16, Bottom Right: M163-16.

