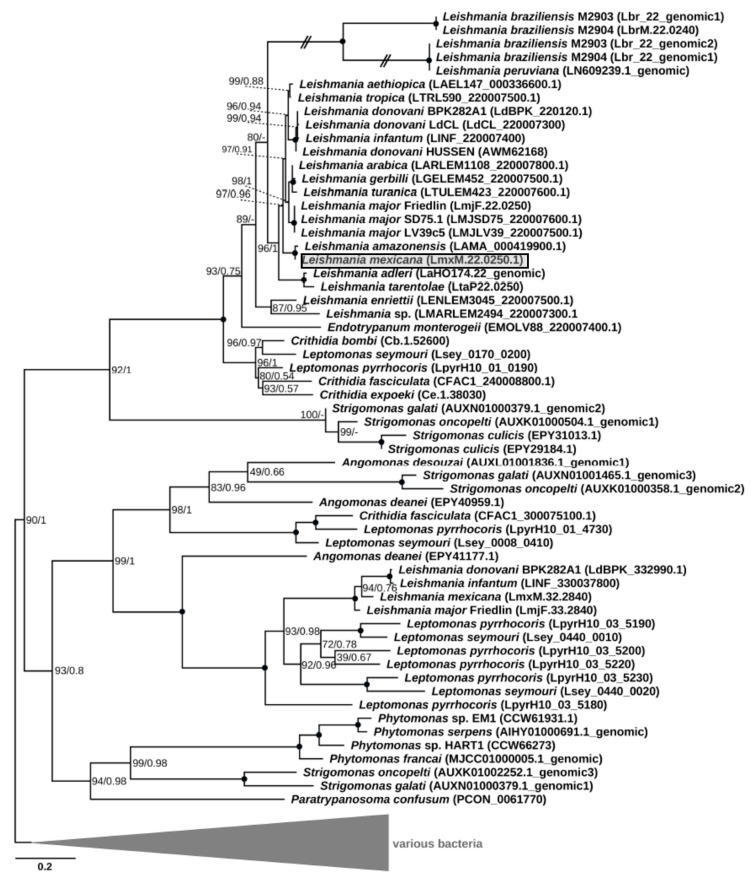
Figure 1.
Maximum-likelihood phylogenetic tree of LmxM.22.0250 and its homologs. Numbers at the nodes represent bootstrap percentage/posterior probability. Nodes with maximal support are marked with black circles. Dashes indicate different topology in the Bayesian tree. The scale bar shows the number of substitutions per site. Double-crossed branches are shown at 25% of their actual length. The gene of interest is boxed and shaded. The tree is rooted with bacterial sequences. In cases where a sequence was not annotated in the genome and could be identified only using TBLASTN, a sequence ID is in the following format: chromosome#_genomic.

