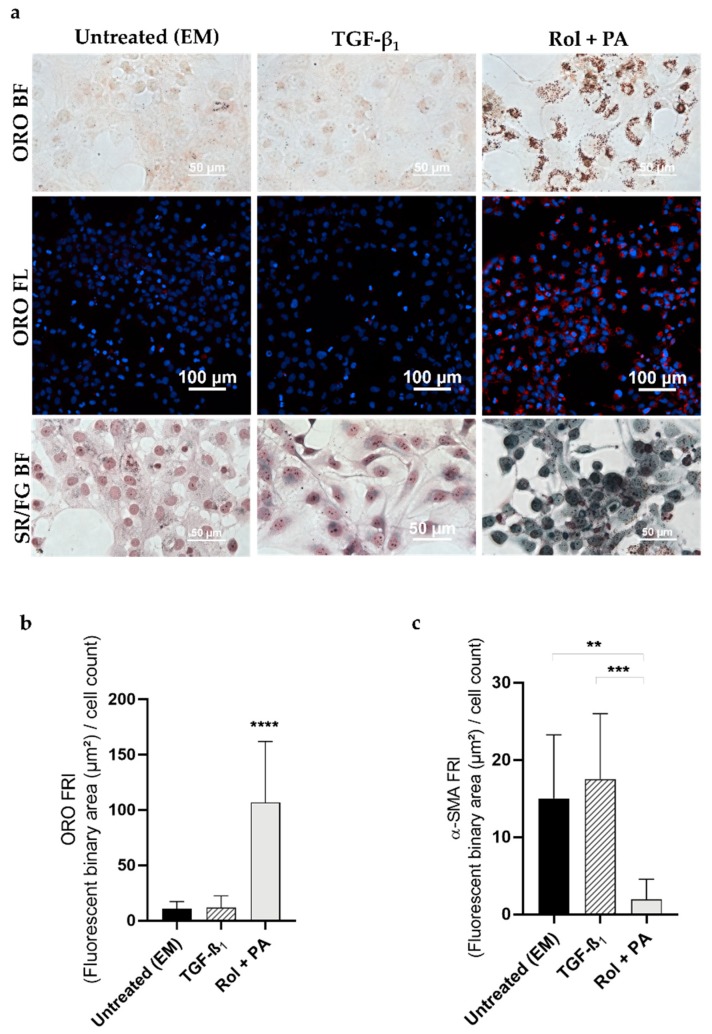
Figure 2.
Effect of TGF-β1 and Rol + PA on pLX-2 cells. (a) Representative microscopy images of lipid droplet staining (ORO in bright field and fluorescence; ORO BF; ORO FL) and collagen staining (Sirius Red/Fast Green in bright field; SR/FG BF). (b) Bar graph showing the ORO fluorescence normalized to the number of cells in the DAPI field (FRI). Mean ± S.D. (n = 3–6). **** p ≤ 0.0001 vs. EM and TGF-β1. (c) Bar graph showing the α-SMA fluorescence normalized to the number of cells in the DAPI field (FRI). Mean ± S.D. (n = 3). ** p ≤ 0.01, *** p ≤ 0.001.

