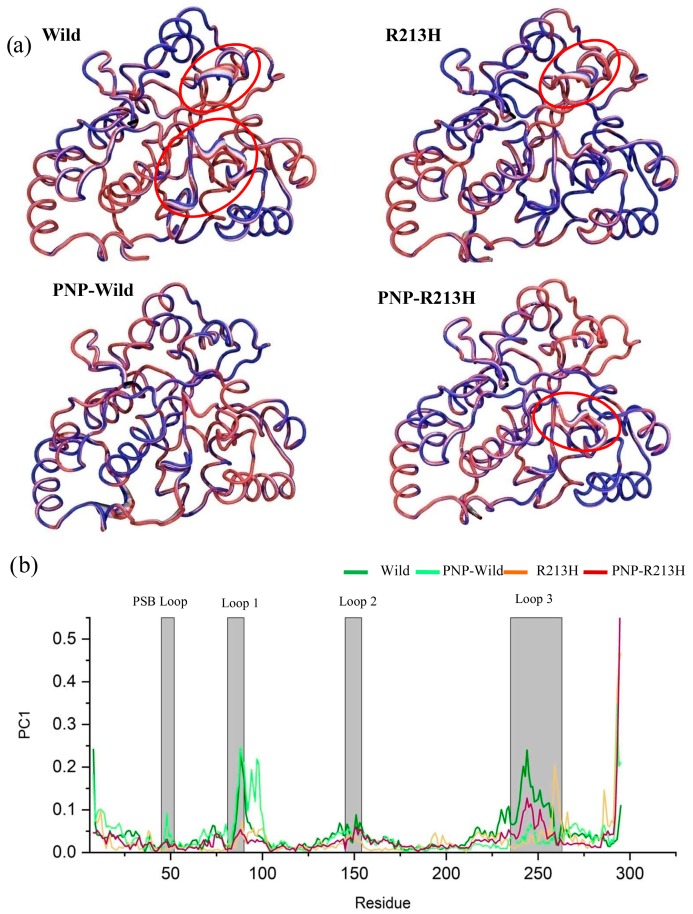
Figure 4.
Changes of protein dynamics due to mutation by means of principle component analysis. Here, principle component 1 is represented in the tube structures of the three dimensional structure of wild, PNP-Wild, R213H, and PNP-R213H, respectively (a). The widen tube means flexibility, highlighted by the red circle. In addition, residue based mobility plot showing the variation in the mobility in PC1 for different simulation systems, where dark green, light green, orange, and dark red colors denote wild, PNP-Wild, R213H, and PNP-R213H, respectively (b).

