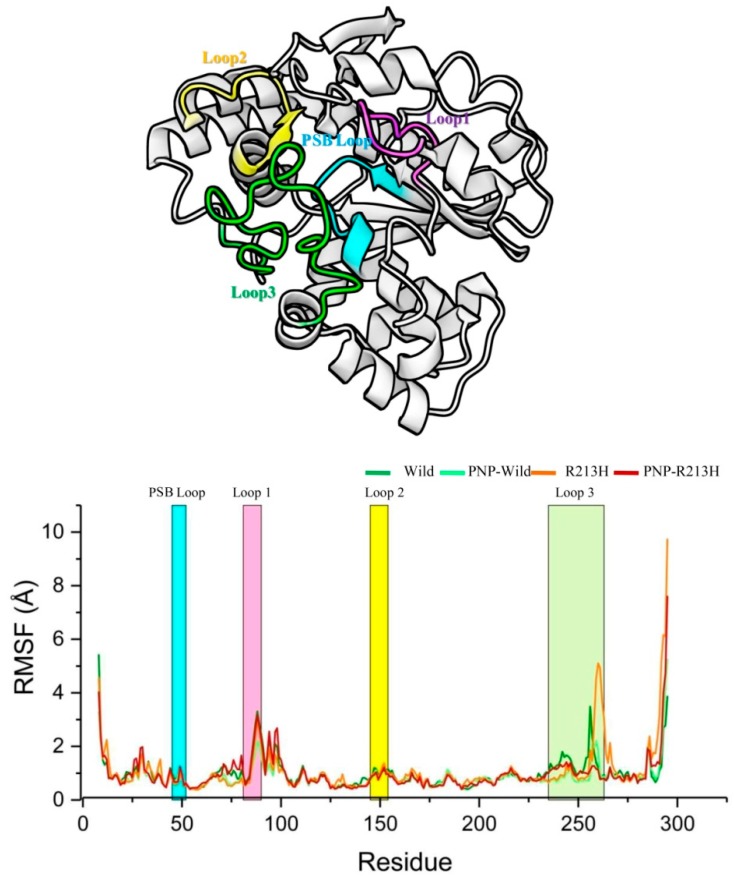
Figure 6.
The root mean square fluctuation (RMSF) of the Cα atoms for the wild protein, R213H, PNP-Wild complex, and PNP-R213H complex. In this graph, dark green line represents wild protein, whereas light green, orange and dark red colors denote wild, PNP-Wild, R213H, and PNP-R213H, respectively. The horizontal x-axis bar region denotes different loop regions.

