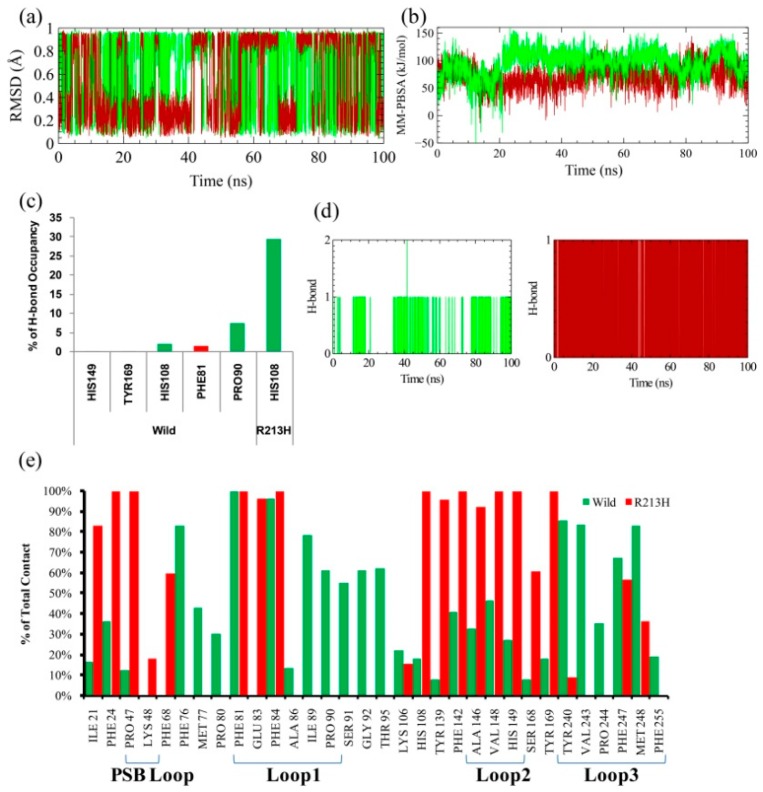
Figure 7.
Ligand RMSD in both wild (green line) and mutated (dark red line), which means the degree of ligand flexibility in substrate binding site (a). MM-PBSA binding energy analysis calculated from the trajectory of 100 ns molecular dynamics simulation with AMBER14 force field, using YASARA dynamics software (b). The total number of intermolecular hydrogen bonds (c) and their occupancy with their respective donor and acceptor (d). Total intermolecular contact analysis (e). Here, green color represents the residues of wild protein with their contact percentage where red color indicates R213H protein contact percentage.

