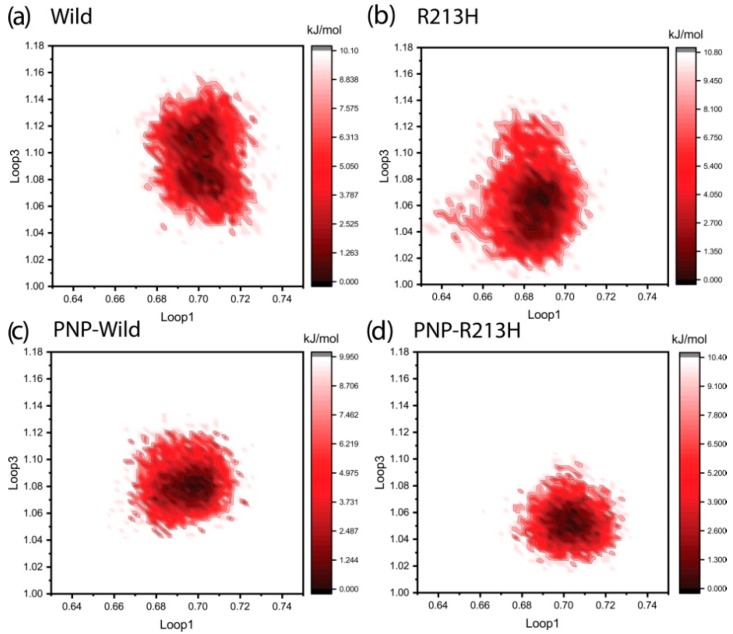
Figure 8.
Energy landscapes of different simulation systems including Wild (a), R213H (b), PNP-Wild (c), and PNP-R213H (d) respectively. Here the reaction coordinates are the Rg (nm) of loop1 (residue 81–90) and loop3 (residues 235–263) as x and y axis, respectively. The color scheme to the right of each plot is given in units of kJ/mol.

