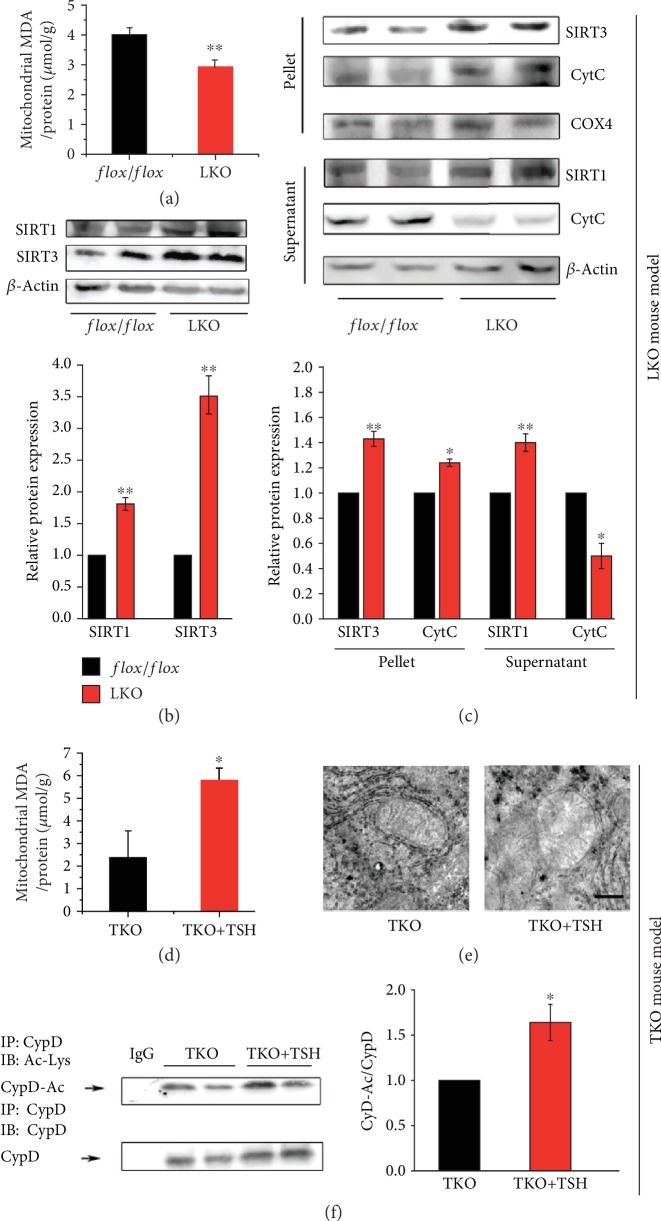
Figure 3.
TSH stimulates mitochondrial stress via the SIRT1/SIRT3/CypD signaling pathway. (a, d) Mitochondrial MDA levels in the liver. (b) Representative images of immunoblotting (upper) and quantification (lower) for SIRT1 and SIRT3 in total liver protein. (c) Representative images of immunoblotting (upper) and quantification (lower) for cytochrome c (CytC) and SIRT1/3 in the mitochondria (pellet) and cytosolic (supernatant) fractions. (e) Representative images of TEM (20000x). (f) Representative images of immunoprecipitation (left) and quantification (right) for CypD acetylation. All mice in the TKO group were supplied with dietary T4 to ensure that serum THs and TSH hormone are basically at the normal level. The data are presented as the mean ± SD. ∗p < 0.05, ∗∗p < 0.01.

