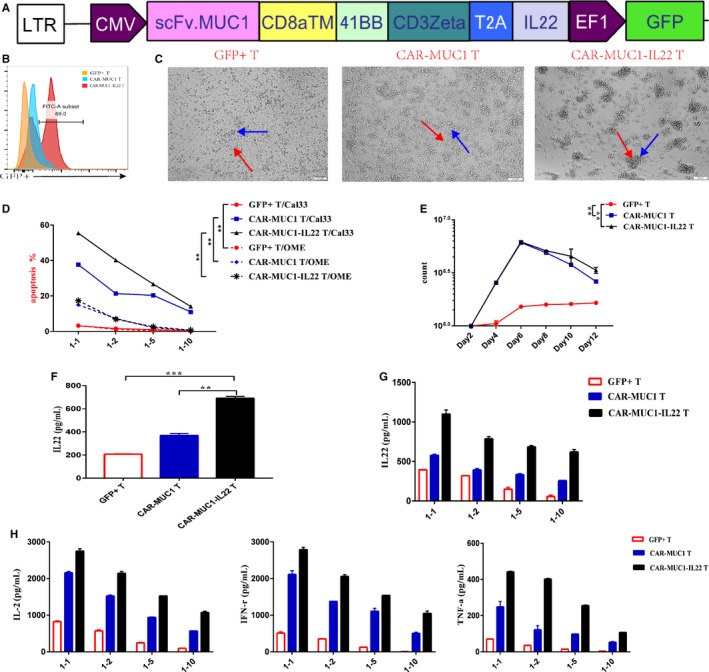
Figure 4.

CAR‐MUC1‐IL22 T cell show improved cytotoxic function. A, Construction of CAR‐MUC1‐IL22. The IL22 CDS region is behind the CAR‐MUC1 structure by 2A peptide. B, T‐cell transfection efficiency of two kinds CAR‐T cells. Flow cytometry tested the positive rate of GFP in transfection when compared with nontransfection. (The orange one is control group, the blue one is the second generation CAR group and the red one is the forth‐generation CAR group). C, Microscopic observation of the ability of two different kinds of CAR‐T cells and GFP+ T cells to capture cells in 1:2 E/T ratio. In GFP+ T cells group, T cells are scattered around the tumor cells; In CAR‐MUC1 T cells group, a little number of CAR‐MUC1 T cells agglomerate around tumor cells; In CAR‐MUC1‐IL22 T cells group, large number of CAR‐MUC1‐IL22 T cells agglomerate around tumor cells (Red arrow is point to the tumor cell; the blue arrow is point to the T cell or two kinds of CAR‐T cells). D, Three different T cells were incubated with tumor cell (Cal33) and non‐neoplastic epithelial cell (OME) at a low E/T ratio (1:1; 1:2; 1:5; 1:10) for 72 h, flow cytometry tested the apoptosis rate of tumor cells (P < .01). The results were the sum of Annexin5 single‐positive rate (early apoptosis) and PI, Annexin5 double‐positive rate (late apoptosis). E, Representative T‐cell expansion profile of three different T cells (P < .01). F, ELISA detected the secretion of IL22 in the culture supernatant (P < .01). G, ELISA detected the secretion of IL22 in the coculture supernatant of different E/T ratio. H, ELISA detected the secretion of IL‐2/IFN‐γ/TNF‐α in the coculture supernatant of low E/T ratio. Each trial was repeated three times, the T cells came from three different healthy donors. Both CAR‐T cell and T cell in each trial came from the same volunteer. (Error bars represent the mean ± SEM. ***P < .001; **P < .01; ns, not significant)
