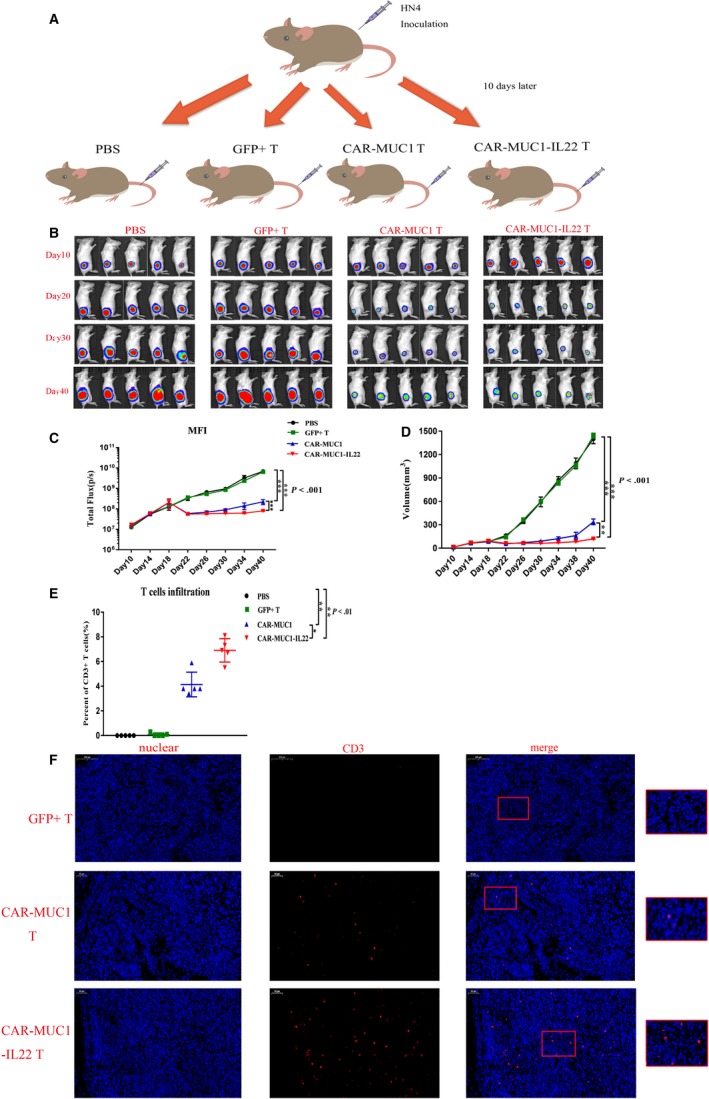
Figure 5.

CAR‐T cells induce tumor degradation of HNSCC in vivo. A, Mouse model of HNSCC: 106 fLuc+ HN4 tumor cells were injected into the subcutaneous tissue in NSG mouse. After 10 d, tail intravenous injection of 100 µL PBS (n = 5), GFP+ T cells (n = 5), CAR‐MUC1 T cells (n = 5), CAR‐MUC1‐IL22 T cells (n = 5). The mice were sacrificed on day 40 for tumor analysis. B, Bioluminescence images of four treatment groups mice. C, Total body bioluminescence units quantitate were measured by bioluminescence photometry and flux values (photons per second, P < .001). D, Tumor volume growth curves of four treatment groups (P < .001). E, T‐cell infiltration statistics in four treatment groups (P < .01). F, CD3 in tumor tissue was detected using the anti‐CD3 antibody (Abcam 5690, dilution 1:200); cell nuclei were stained with DAPI. Scale bar represents 200 µm. (Error bars represent the mean ± SEM. ***P < .001; **P < .01; *P < .05; ns, not significant)
