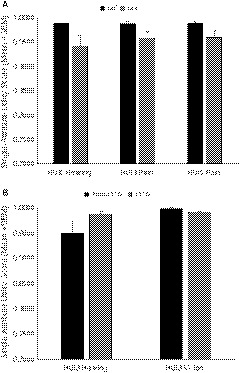
Figure 2.

Significant findings (P < .05) for single‐attribute utility scores from the HUI2 and HUI3 across the entire sample in relation to (A) metastatic status and (B) resection. Single‐attribute utility scores range from 1.00 (no morbidity) to 0.00 (worst level of impairment). Mean values and standard error of the mean (SEM) are shown. GTR, gross total resection; M0, nonmetastatic; M+, metastatic
