
Figure 3.
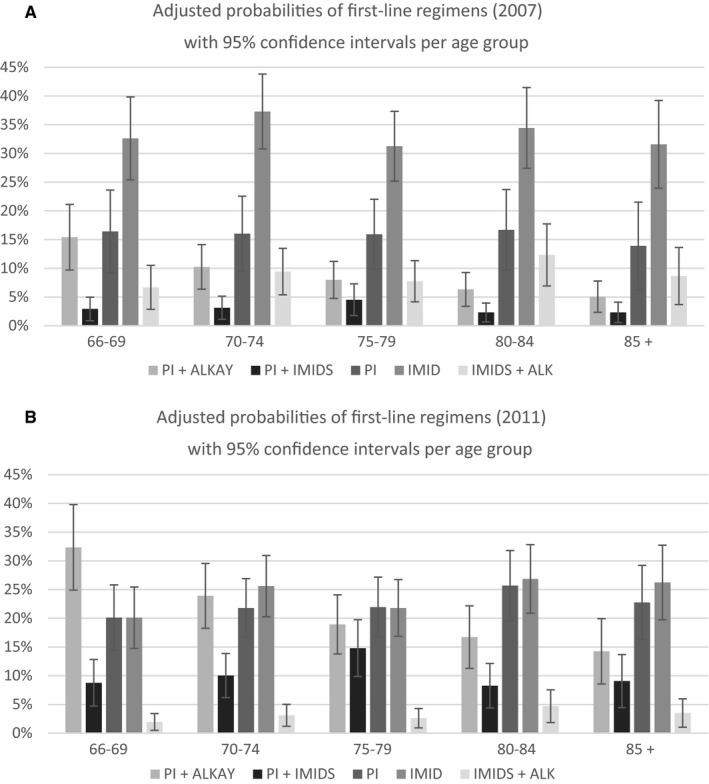
Adjusted probabilities of first‐line regimens. A, Adjusted probabilities of first‐line regimens (2007) with 95% confidence intervals per age group. B, Adjusted probabilities of first‐line regimens (2011) with 95% confidence intervals per age group