
Figure 4.
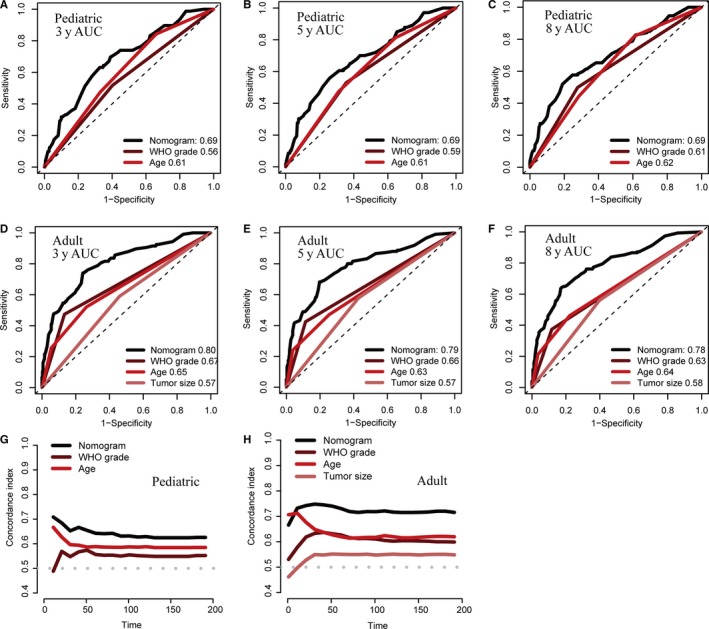
The prognostic performances were compared between nomogram models and different conventional clinical characteristics by ROC curves and time‐dependent C‐index. Comparison of the ROC curves of the nomogram model and different conventional clinical characteristics for 3‐ (A), 5‐ (B) and 8‐y (C) OS prediction in the pediatric training set, and 3‐ (D), 5‐ (E) and 8‐y (F) OS prediction in the adult training set; The prognostic performance was compared between the nomogram model and different conventional clinical characteristics by calculating the C‐index in the pediatric (G) and adult (H) training sets. AUC, areas under the ROC curve; C‐index, concordance index; ROC, receiver operating characteristic curve