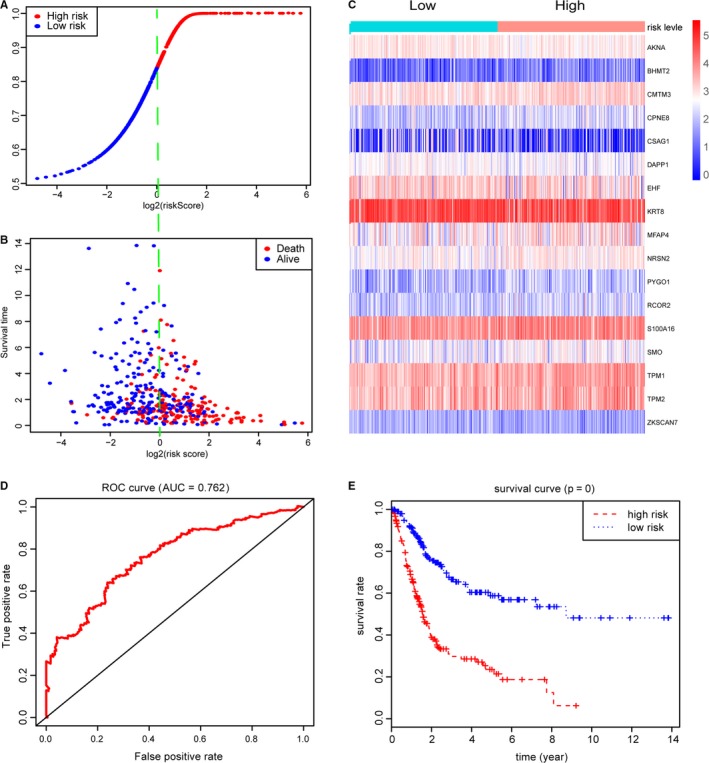
Figure 5.

Construction of risk scores based on 17 hub MDGs. A‐B, Distribution of vital status of 405 BCA patients in high‐ and low‐risk groups. C, Heatmap of expression levels for hub MDGs in patients with high‐ and low‐risk score levels. D, ROC curve for 3‐year prediction was utilized for assessing the prognostic values of risk score with AUC = 0.762. E, Bca patients in high‐risk group revealed worse survival outcomes than that in low‐risk groups
