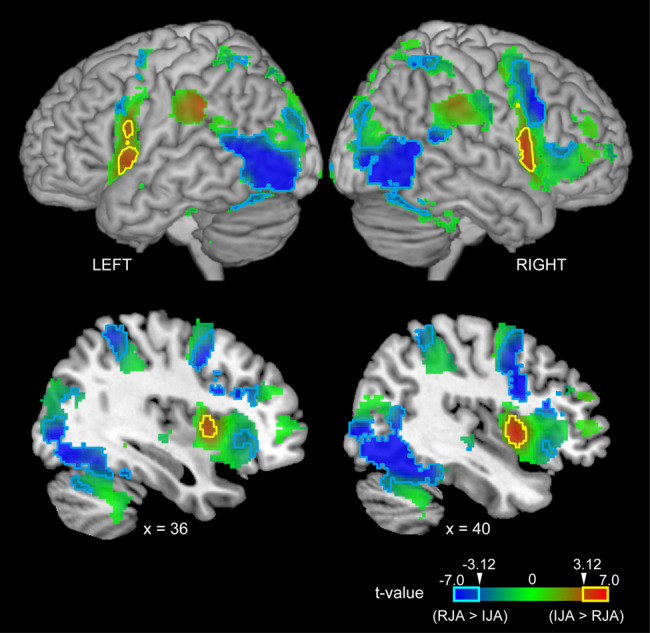
Fig. 5.

Task specificity within the JA region (see Figure 3). Red indicates IJA specificity ([IJA + dIJA] > [RJA + dRJA]), blue indicates RJA specificity ([RJA + dRJA] > [IJA + dIJA]) and green indicates intermediate specificity. The cyan and magenta lines indicate regions exhibiting statistically significant effects in terms of responding to and initiating JA, respectively (t > 3.12 corresponding to an few-corrected P < 0.05 at cluster level).
