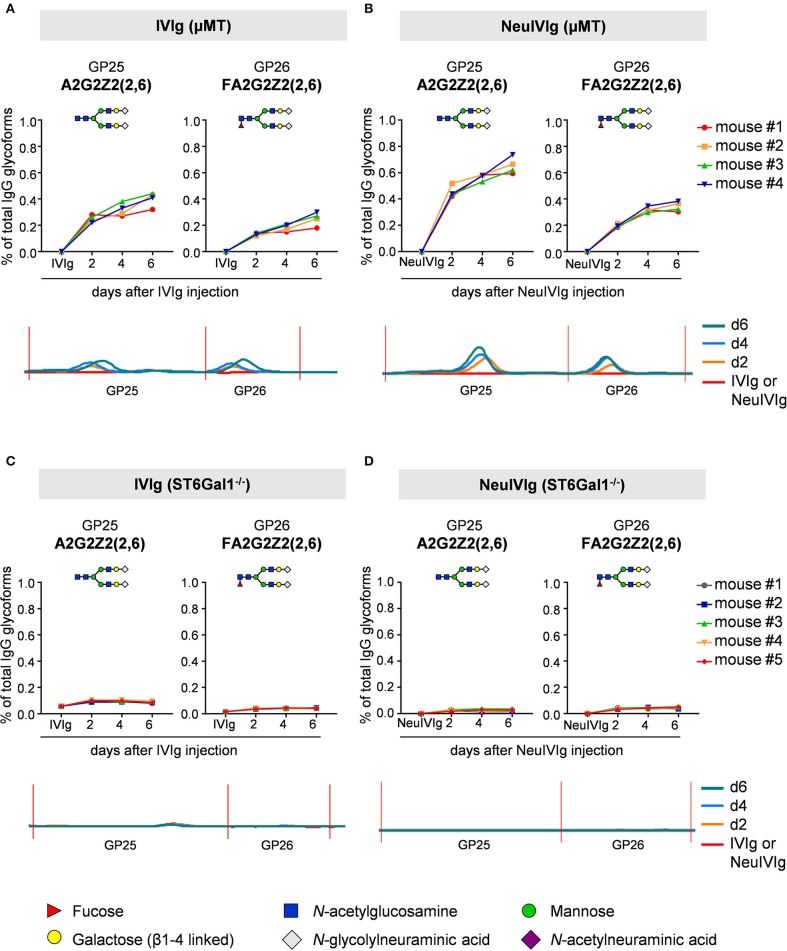
Figure 3.
Kinetics of extrinsic IgG sialylation in μMT and ST6Gal1 deficient mice. Shown are the relative changes (% of total IgG glycoforms in the preparation) in glycopeaks (GP) 25 and 26 in IVIg (A,C) or neuraminidase treated IVIg (B,D) before (IVIg or NeuIVIg) and 2, 4, and 6 days after injection into μMT (A,B) or ST6Gal1 deficient mice (C,D) by HILIC-UPLC-FLR analysis. Changes in the respective glycopeak in individual mice are shown at the top of each figure (n = 4–5). The bottom of each Figure shows a representative HILIC-UPLC-FLR trace of GP25 and 26. In each subfigure a schematic drawing of the sugar structure for GP25 and 26 is depicted. The Figure legend at the bottom explains the symbols used for the schematic representation of the sugar moieties.

