FIGURE 4.
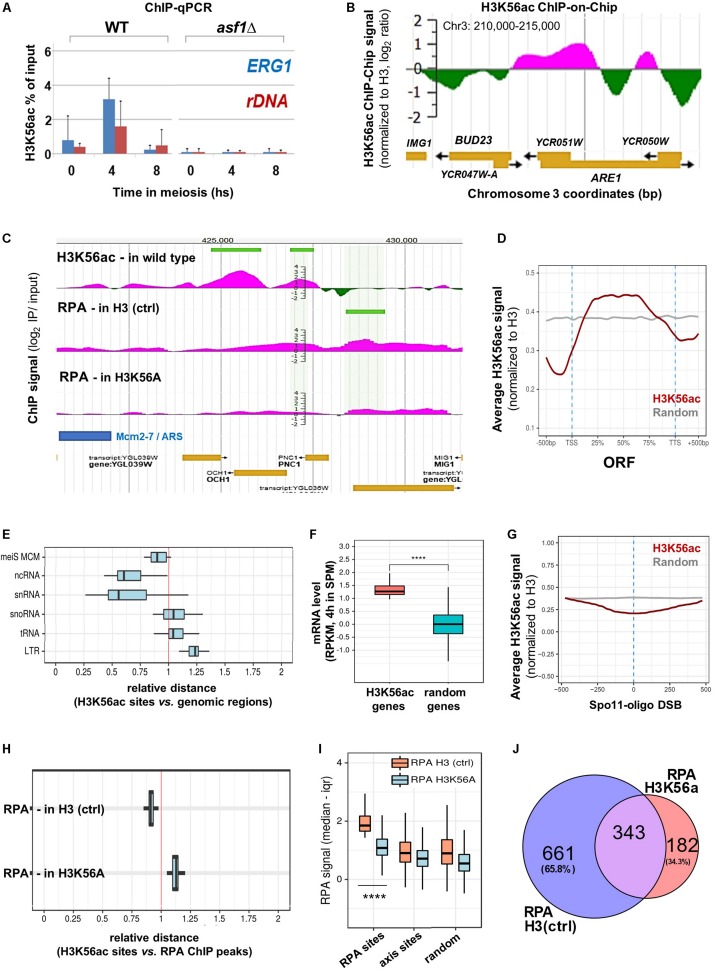
Genome-wide mapping of H3K56ac and RPA. (A) H3K56ac capture using an anti-H3K56ac antibody. H3 (C-ter) ChIP was performed to normalize to H3 occupancy. ChIP-qPCR enrichments were measured at ERG1 and rDNA. Error bars: SEM. (B) H3K56ac signal detected by microarray (at 5 h in SPM). IP/input ratios were normalized to H3 occupancy (Borde et al., 2009). (C) Genome browser snapshot showing the distribution of H3K56ac in wild type cells and RPA enrichment in H3 (ctrl) and H3K56A cells. Peaks are highlighted by horizontal green lines. (D) Metagene profile of H3K56ac over protein-coding genes. Red curve shows the median H3K56ac signal. Gray curve: random signal. (E) Relative distance of H3K56ac peaks from various genomic regions. Vertical red line: random distances. Shift toward the left or right sectors: clustering or repulsion between H3K56ac peaks and the studied genomic elements. Mei MCM: meiotic replication origins (Blitzblau et al., 2012). (F) Genes associated with high H3K56ac levels show increased mRNA expression compared to random genes. Statistical significance: p < 0.0001 (Mann–Whitney U test). RNA-seq data are from Brar et al. (2012). (G) Depletion of H3K56ac over Spo11-oligo DSBs (Mohibullah and Keeney, 2017). Gray line: random signal. (H) Relative distance of H3K56ac peaks from RPA peaks in H3 (ctrl) and H3K56A cells. Vertical red line: random distance. (I) Distribution of RPA ChIP signal at RPA binding sites, axis sites (Mer2; Panizza et al., 2011), and random sites in H3 (ctrl) and H3K56A cells. Statistical significance: p < 0.0001 (Mann–Whitney U test). (J) Overlap of RPA peaks in H3 (ctrl) and H3K56A cells.

