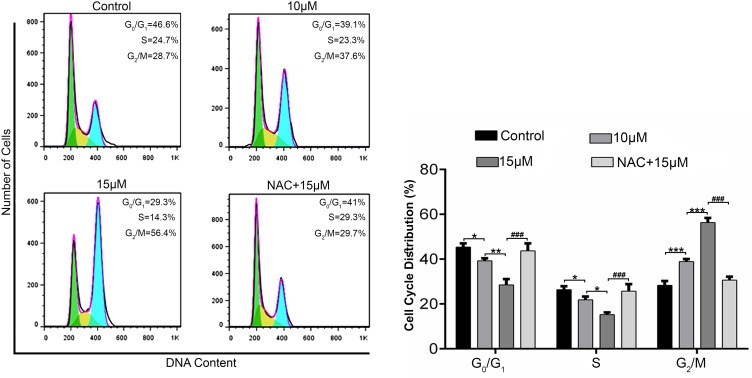
Figure 2.
Effect of Brv-A on cell cycle distribution in MCF-7 cells. MCF-7 cells were treated with indicated concentrations of Brv-A in presence or absence of NAC for 24 h, stained with PI and analyzed by flow cytometry. Representative DNA fluorescence histograms of PI-stain cells show the cell cycle distribution. Histograms show number of cells on y-axis while DNA content on x-axis. The values display percentages of cells in indicated phases of cell cycle. Data are expressed as Mean ± SD while all experiments were performed in triplicate independently. *p <0.05, **p <0.01, ***p <0.001 vs untreated group (control) while ###p <0.001 vs 15 µM treated group.

