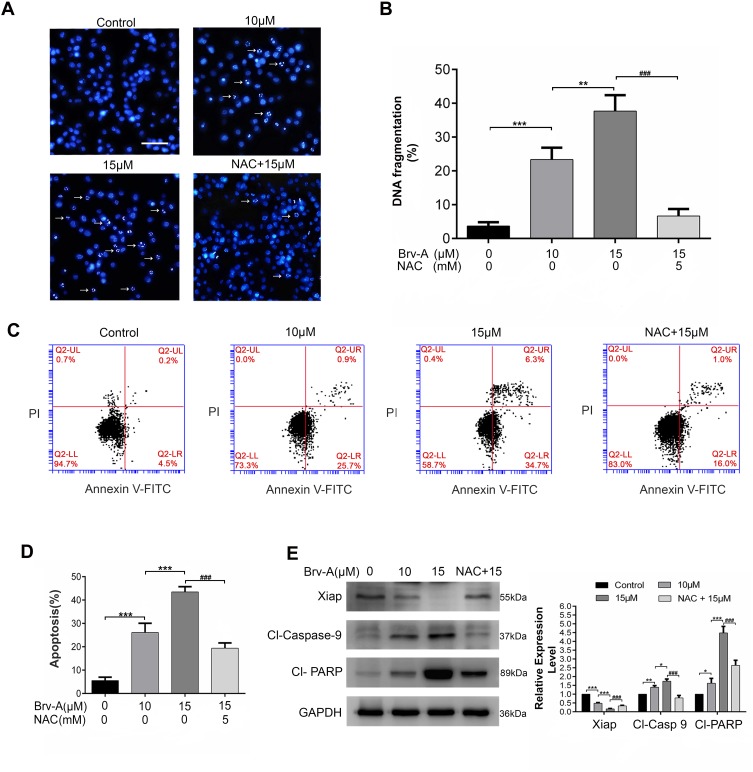
Figure 3.
Induction of apoptosis by Brv-A in MCF-7 cells. (A) MCF-7 cells were treated with 10 µM and 15 µM concentrations of Brv-A in presence or absence of NAC for 24 h and stained with Hoechst 33258 for nuclear morphological changes. Scale bar is 100 µm. (B) In each group, among 100 cells, fragmented nuclei were counted under microscope. (C, D) Cells were treated with 10 µM and 15 µM Brv-A in presence or absence of NAC for 24 h. All samples were analyzed by flow cytometry after staining with annexin V-FITC and PI. (E) Cells were treated for 24 h with indicated concentrations of Brv-A in presence/absence of NAC. Protein extracts were prepared and analyzed by Western blotting to see expression level of apoptosis markers, ie Xiap, cleaved caspase-9 and cleaved PARP. GAPDH was used as loading control. Graphical data in (B, D, E) are expressed as Mean ± SD while all experiments were performed in triplicate independently. *p <0.05, **p <0.01, ***p <0.001, vs untreated group (control) while ###p <0.001 vs 15 µM treated group.

