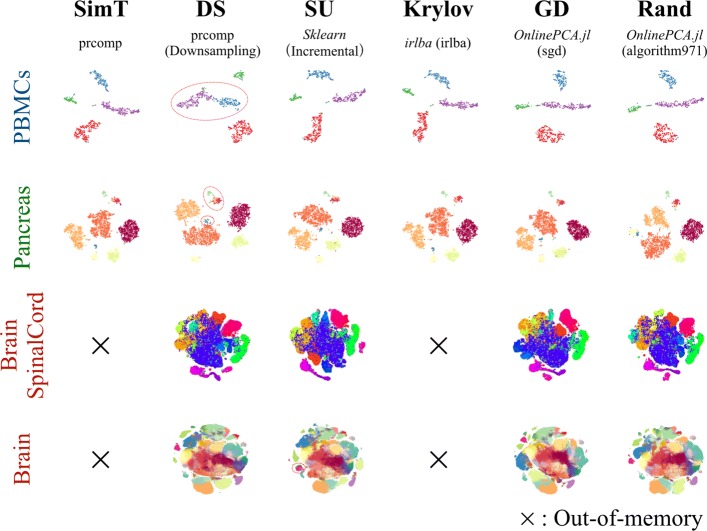
Fig. 3.
The comparison of t-stochastic neighbor embedding (t-SNE) plots. Comparison of multiple principal component analysis (PCA) implementations performed with empirical datasets: PBMCs (102 cells), Pancreas (103 cells), BrainSpinalCord (105 cells), and Brain datasets (106 cells). t-SNE was performed with the result of each PCA implementation. Some distinct clusters determined by the original studies were incorrectly combined into single clusters (red circled cluster)

