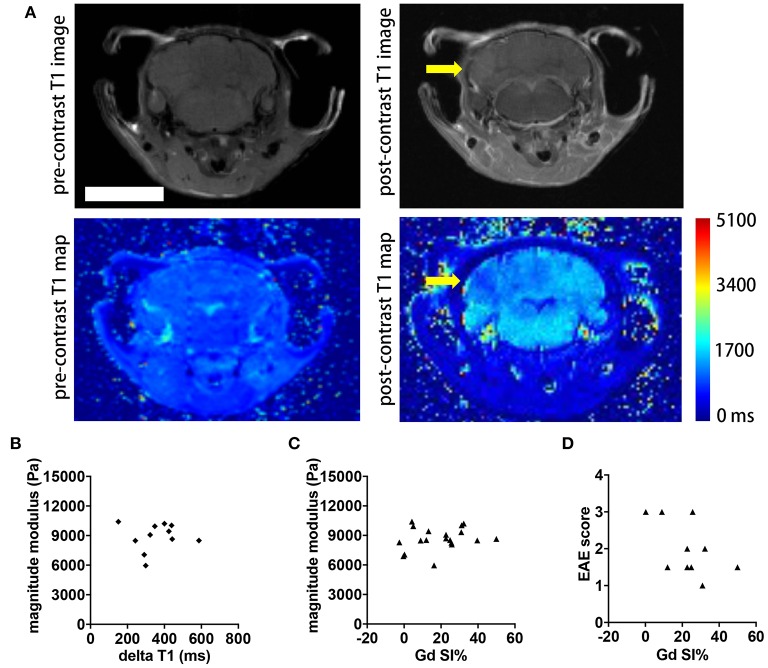
Figure 4.
Comparison of whole brain contrast-enhancing lesion burden with whole brain viscoelasticity. (A) Representative T1-weighted MR images pre- (left) and post- (right) GBCA administration. A diffuse contrast-enhancing lesion is seen in the cerebellum (arrow). T1 map pre- and post-contrast with T1 relaxation time in ms. Scale bar = 5 mm. (B) Delta T1 (mean pre-contrast minus mean post-contrast) did not correlate with the magnitude modulus (Pearson correlation, p = 0.8797, r = 0.05181). (C) T1 signal intensity changes (SI%) obtained from the T1-weighted images following Gd application showed no correlation with the magnitude modulus (Pearson correlation, p = 0.3402, r = 0.2315). (D) There was no significant correlation between SI% and the EAE score (Spearman correlation, p = 0.2325, r = −0.4195). Data from two independent experiments, n = 11 and n = 19 in (B–D), respectively.

