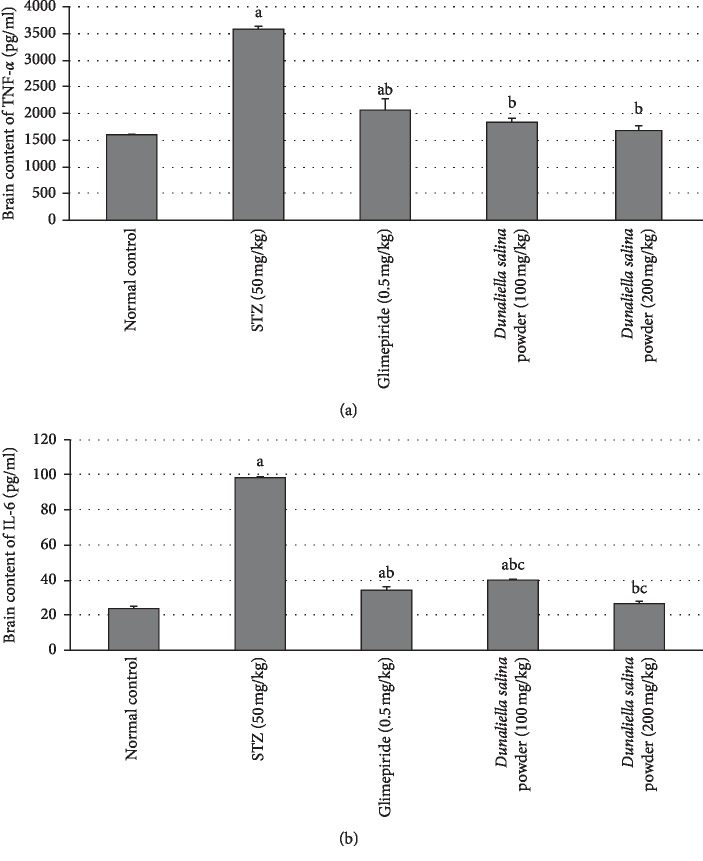
Figure 3.
Effects of D. salina on brain contents of (a) TNF-α and (b) IL-6. Data are presented as the mean ± S.E. (n = 8). Statistical analysis was performed by one-way analysis of variance followed by Tukey's multiple comparisons test. asignificant from the normal group. bsignificant from the STZ group. csignificant from glimepride group at P < 0.05.

