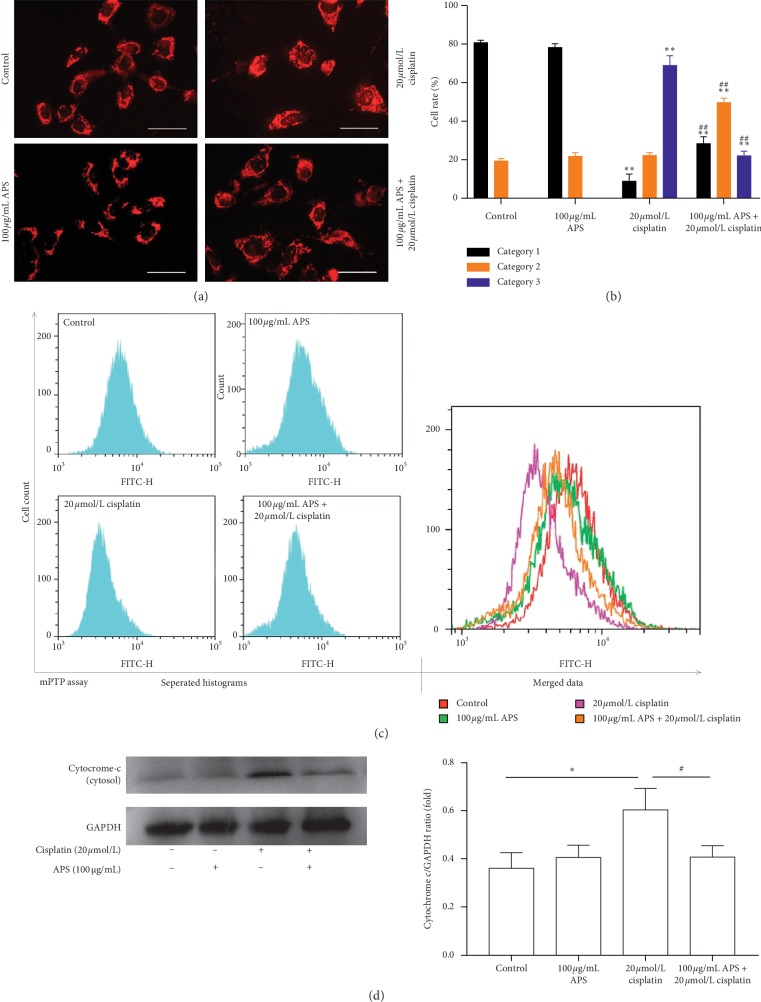
Figure 6.
APS ameliorates the cisplatin-triggered mitochondrial dysfunction in HK-2 cells. (a) MitoTracker® Red CMXRos staining of HK-2 cells with different treatments (original magnification ×400; bar = 100 μm). (b) Quantification of mitochondrial morphology as category 1 (elongated tubulin-like structure), category 2 (large round or short tubular), and category 3 (round or punctate) in 6 random fields. (c) Representative flow cytometry curves of the HK-2 cells stained by mPTP assay kit. (d) Western blot analysis of cytoplasmic cytochrome c level in HK-2 cells with different treatments. Graphs showing the results of quantitative analysis are shown on the right. Data are means ± SEM (n = 3). ∗P < 0.05, ∗∗P < 0.01 versus the control group; #P < 0.05, ##P < 0.01 versus the cisplatin alone-treated group.

