. 2020 Jan 9;9:e51708. doi: 10.7554/eLife.51708

Figure 1. BgFREP3, which had special high abundance in BS-90 plasma, interacted with BgTEP1 and Biomphalysin derived from both M-line and BS-90 plasma, while uniquely associated with BgFREP2 and a BgFREP3 variant from BS-90 plasma.

(A) Schematic diagram and Western blot analysis of recombinant proteins, the ends of which are coupled to the tags V5 and ploy-His for protein immunoassay and purification operations. The yellow star in the schematic structure of rBgTEP1 represents the thioester motif. (B) The background expression of BgFREP3 in BS-90 snail plasma was significantly higher than that in M-line plasma. The haemolymph of four snails from each M-line and BS-90 strain was independently extracted, and haemocytes were removed by centrifugation to obtain plasma samples. After the plasma of each snail was quantified, the same amount of plasma was used for SDS-PAGE electrophoresis and Western blot analysis. Anti-IgSF #1 and anti-FBG #1 antibodies of BgFREP3 were used as primary antibodies. (C) The rBgFREP3 associated with BgTEP1 and Biomphalysin in both M-line and BS-90 plasma, but exclusively interacted with a BgFREP3 variant and BgFREP2 in BS-90 plasma. The eluent of rBgFREP3 pull-downs was collected and separated on 6% (upper panel) and 10% (lower panel) SDS-PAGE gels before silver staining. (E) The rBgTEP1 interacted with Biomphalysin and BgFREP2 in both M-line and BS-90 plasma. The eluent of pull-down experiments with rBgTEP1was separated on 10% SDS-PAGE gels. In the pull-down experiments with rBgFREP3 (C) and rBgTEP1 (E), cell-free plasma from M-line (green) or BS-90 (red) B. glabrata snails was incubated with Sf9 cell lysates expressing rBgFREP3 or concentrated medium containing rBgTEP1 together (interactome experiments, last two lanes) or alone (controls, first three lanes). Bands that differ between control and interactome experiments were cut, proteins submitted to tryptic digest and analyzed by LC-MS/MS for identification. In interactome experiments, bands that differ between M-line and BS-90 lanes were marked with red arrows. The results of mass spectrometry analysis are shown in the figure. Proteins (BgTEP1 and Biomphalysin) represented by black font interacted with rBgFREP3 in both M-line and BS-90 plasma. Proteins (BgFREP2 and BgFREP3.3) represented by blue font specially interacted with rBgFREP3 only in BS-90. (D, F and G) Distribution of peptides identified by LC-MS/MS on BgTEP1.5 (ADE45333.1), Biomphalysin (A0A182YTN9) and BgFREP2 (AAK13550.1). The text on the panels describes the peptides identified from different Pull-down experiments, and most peptides were identified multiple times. The text with the green background describes peptides identified from the plasma of M-line strain in the rBgFREP3 pull-down experiments, and corresponding the text with the red background represents the peptides from the plasma of BS-90 strain. Similarly, the text in the green frame box represents the peptides from the plasma of the M-line strain in the rBgTEP1 pull-down experiments, and corresponding the text in the red frame box represents the peptides from the plasma of the BS-90 strain. The horizontal lines in panels D, F and G represent the full-length amino acid sequences of BgTEP1.5, Biomphalysin and BgFREP2. The light blue dots and dashes indicate the location of the peptides. The purple Arabic numerals represent the number of identified peptide fragments that differ from each other.

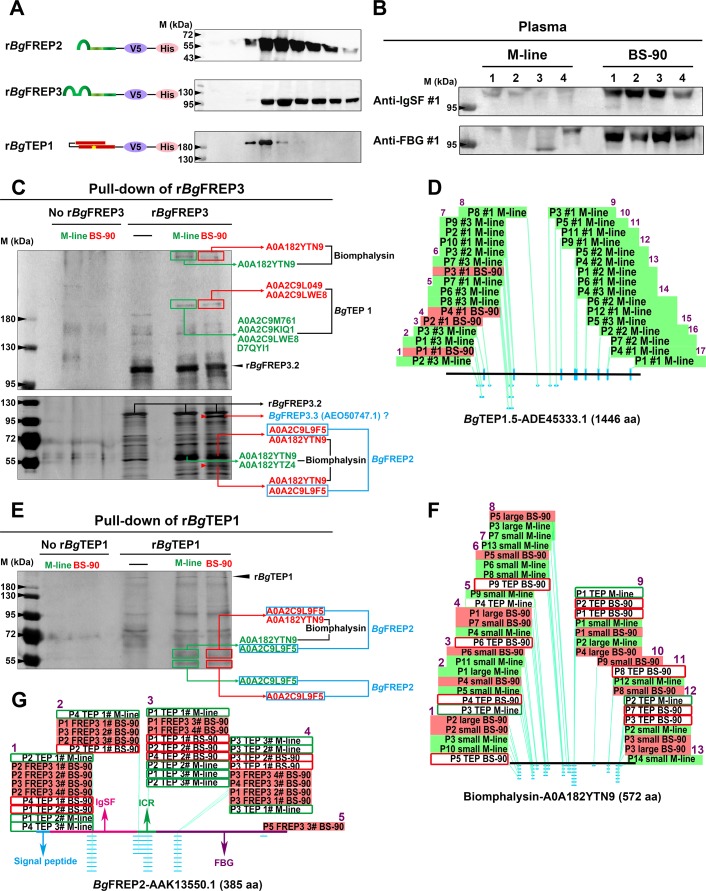
Figure 1—source data 1. Nucleotide sequence for cloning rBgFREP3.
This sequence is derived from GenBank AY028461.1. There are differences in nucleotide sequence but the amino acids match 100%. The differences are due to codon-optimization for expression in insect Sf9 cells. GenBank annotations are used to locate the individual BgFREP3.2 domains: underline, signal peptide; gray shading, IgSF1 domain; double underline, small connecting region; gray shading plus frame, IgSF2 domain; wavy underline, ICR; bold underline, FBG domain; delete line, termination codon.
Figure 1—source data 2. The peptides identified by LC-MS/MS were distributed over the full-length BgTEP, but could not be used to distinguish which BgTEP variant was present.
Peptides identified by LC-MS/MS from rBgFREP3 pull-down experiments are highlighted in gray. The GenBank accession numbers of each entry are: BgTEP, ACL00841.1; BgTEP1.1, ADE45332.1; BgTEP1.2, ADE45339.1; BgTEP1.3, ADE45340.1; BgTEP1.4, ADE45341.1 and BgTEP1.5, ADE45333.1.
Figure 1—source data 3. The two Biomphalysin variants (UniProtKB/TrEMBL: A0A182YTN9 and A0A182YTZ4) identified by LC-MS/MS shared high sequence identities but were different from the previously published Biomphalysin (GenBank: AGG38744.1).
(A) Alignment analysis of AGG38744.1 and A0A182YTN9. (B) Alignment analysis of AGG38744.1 and A0A182YTZ4. (C) Multiple sequence alignment of AGG38744.1, A0A182YTN9 and A0A182YTZ4. The identified peptides in A, B and C are highlighted in gray. The yellow squares and red plus signs in A and B represent sites with differing amino acids. The red frame in A, B and C representing differences in peptide sequences that distinguish two Biomphalysin variants (A0A182YTN9 and A0A182YTZ4).
Figure 1—source data 4. The identified protein (UniProtKB/TrEMBL: A0A2C9L9F5) represented a variant of BgFREP2 members that was distinct from other BgFREP members, but was indistinguishable from other BgFREP2 variants.
(A) The amino acid sequence information of protein A0A2C9L9F5 derived from the B. glabrata proteome database (Genome Accession: GCA_000457365). Peptides identified by LC-MS/MS are highlighted in gray. (B) Alignment of multiple BgFREP amino acid sequences and distribution of identified peptides. Peptides identified by LC-MS/MS are highlighted in gray. The GenBank accession numbers of each entry are: BgMFREP1 partial, AAK13549; BgMFREP2 precursor, AAK13550; BgFREP3-2 precursor, AAK28656; BgMFREP4 precursor, AAK13551; BgMFREP5 partial, AAK13546; BgMFREP6 partial, AAK13552; BgFREP7.1 precursor, AAK28657; BgMFREP8 partial, AAK13553; BgMFREP9 partial, AAK13554; BgMFREP10 partial, AAK13555; BgMFREP11 partial, AAK13556; BgFREP12.1 precursor, AAO59918; BgFREP12-FBG2, AAT58639; BgFREP13.1 precursor, AAO59922 and BgFREP14, ABO61860. (C) Blast analysis of protein A0A2C9L9F5 in NCBI database. The top 30 proteins with the highest scores are listed. (D) Multiple sequence alignment of 30 BgFREP2 family proteins listed in C. Peptides identified by LC-MS/MS are highlighted in gray.
Figure 1—source data 5. Alignment of multiple BgFREP3 amino acid sequences and distribution of identified peptides.
Peptides identified by LC-MS/MS are highlighted in gray, the overlapping region of peptides are bold underline. GenBank annotations of BgFREP3.2 (AAK28656.1) are used for locate the individual BgFREP3 domains: orange, signal peptide; green, IgSF1 domain; blue, small connecting region; pink, IgSF2 domain; black, ICR; red, FBG domain.

Figure 1.

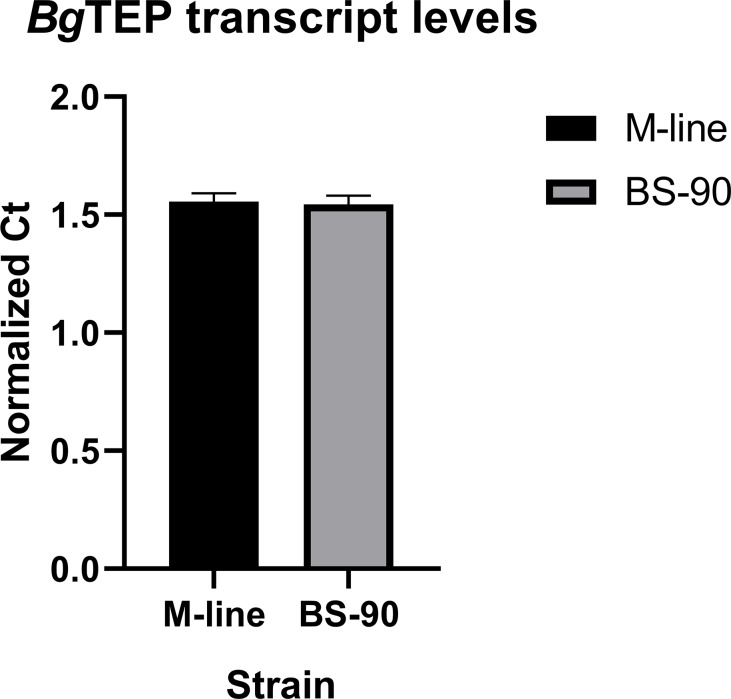
Figure 1—figure supplement 1. Normalized transcript abundance of BgTEP1 in unchallenged M-line (black bar, n = 5) and BS-90 (gray bar, n = 5) snails indicating a lack of significant difference (p>0.05) between the two strains.

Figure 1—figure supplement 1.