. 2019 Dec 16;8:e49375. doi: 10.7554/eLife.49375

Figure 1. Cryo-EM structure of TraR-Eσ70.

(top) Color-coding key. (A) TraR-Eσ70(I) - cryo-EM density map (3.7 Å nominal resolution, low-pass filtered to the local resolution) is shown as a transparent surface and colored according to the key. The final model is superimposed. (B) TraR-Eσ70(II) - cryo-EM density map (3.8 Å nominal resolution, low-pass filtered to the local resolution) is shown as a transparent surface and colored according to the key. The final model is superimposed. (C) Top view of TraR-Eσ70(I). The boxed area is magnified in (D). (D) Magnified top view of TraR-Eσ70(I) - shows TraRN (starting near RNAP active site Mg2+, extending out secondary channel), TraRG (interacting primarily with β'rim-helices), and TraRC (interacting with βlobe-Si1). (E – G) Cryo-EM density (blue mesh) defining the TraR structure. (E) TraRN and -NADFDGD- motif of RNAP β' (chelating active site Mg2+). (F) TraRG. (G) TraR C.

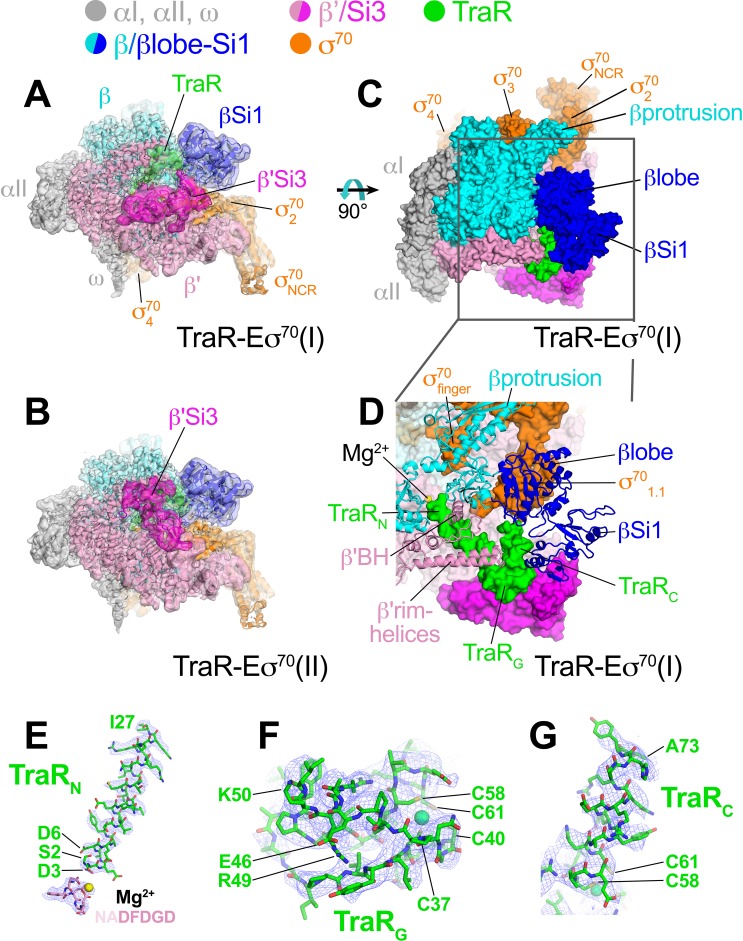
Figure 1.

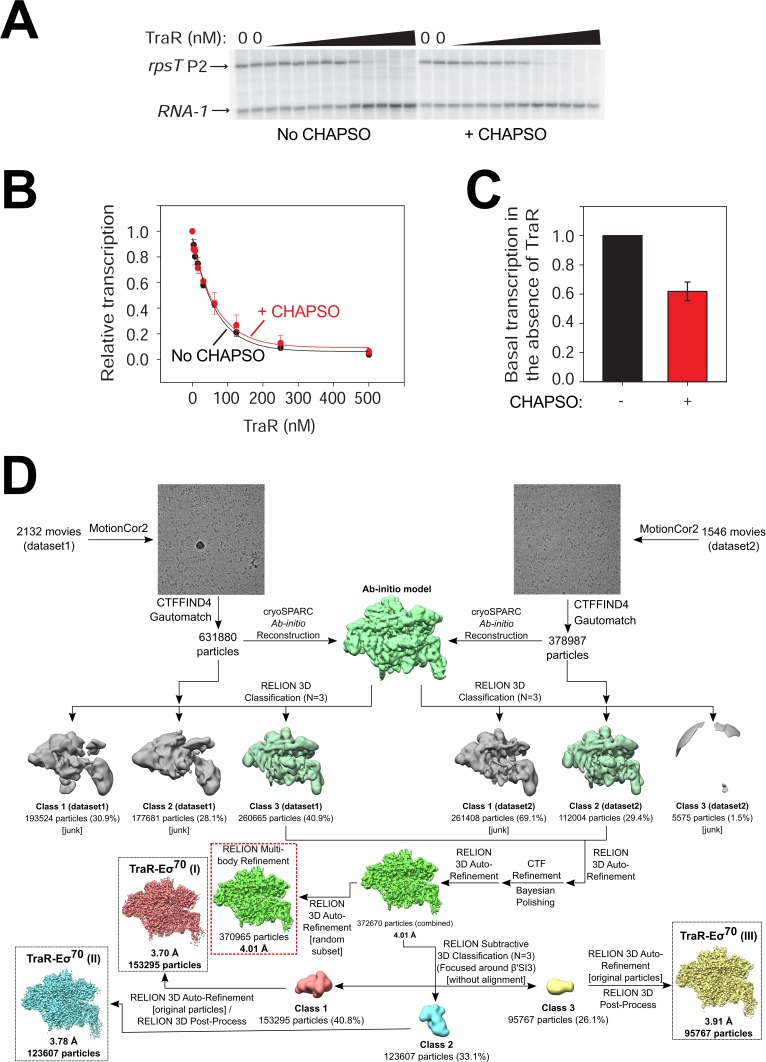
Figure 1—figure supplement 1. Cryo-EM solution conditions do not affect TraR function and TraR-Eσ70 cryo-EM processing pipeline.

Figure 1—figure supplement 1.

(A) Multi-round in vitro transcription of rpsT P2 by Eσ70 (20 nM) at a range of TraR concentrations (wedge indicates 4 nM - 4 µM) in the absence or presence of 8 mM CHAPSO as indicated. Plasmid templates also contained the RNA-1 promoter. Small effects of TraR on RNA-1 have been reported previously (Gopalkrishnan et al., 2017) but the physiological significance is unclear. (B) Quantification of transcripts from experiments like those in (A) plotted relative to values in the absence of TraR. The IC50 for inhibition by TraR was ~50 nM for both ± CHAPSO data sets. Averages with range from two independent experiments are plotted. (C) Transcription in the absence of TraR is plotted, relative to the same reactions without CHAPSO. Although it had no effect on the concentration of TraR required for half-maximal inhibition (B), CHAPSO reduced transcription slightly. Averages with range from two independent experiments are plotted. (D) TraR-Eσ70 cryo-EM processing pipeline.
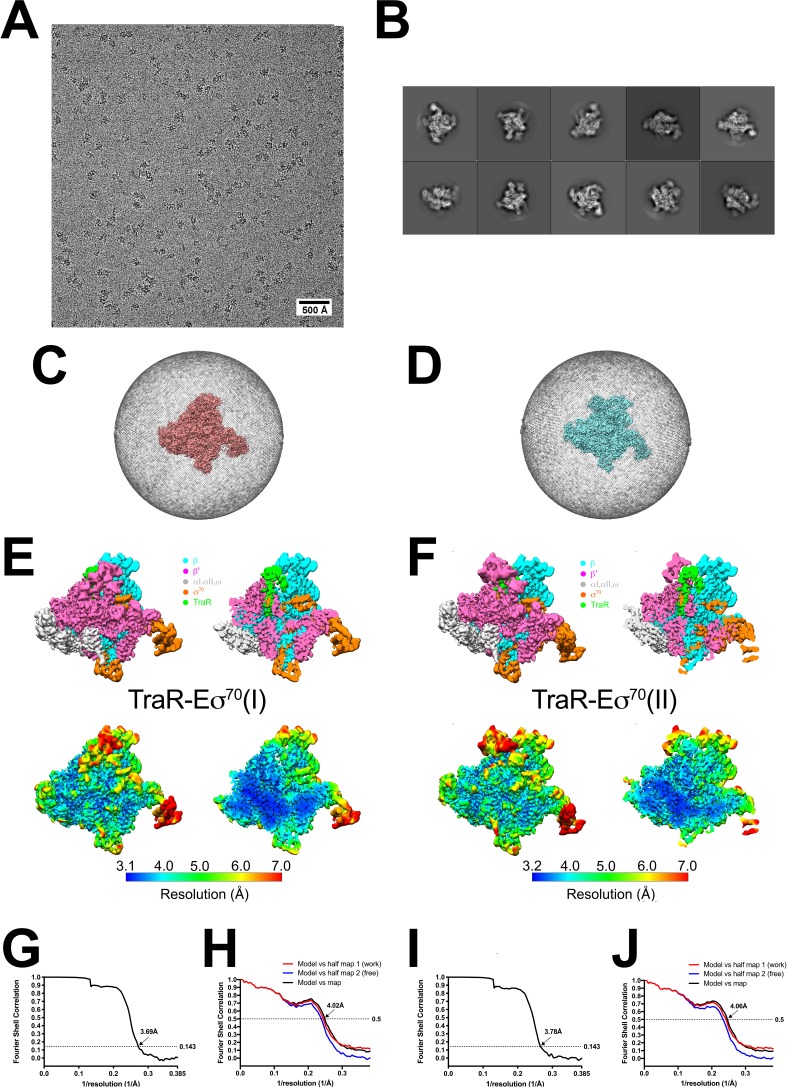
Figure 1—figure supplement 2. TraR-Eσ70 cryo-EM.

Figure 1—figure supplement 2.

(A) Representative micrograph of TraR-Eσ70 in vitreous ice. (B) The ten most populated classes from 2D classification. (C) Angular distribution for TraR-Eσ70(I) particle projections. (D) Angular distribution for TraR-Eσ70(II) particle projections. (E) (top) The 3.7 Å resolution cryo-EM density map of TraR-Eσ70(I) is colored according to the key. The right view is a cross-section of the left view. (bottom) Same views as (top) but colored by local resolution (Cardone et al., 2013). (F) (top) The 3.8 Å resolution cryo-EM density map of TraR-Eσ70(II) is colored according to the key. The right view is a cross-section of the left view. (bottom) Same views as (top) but colored by local resolution (Cardone et al., 2013). (G) Gold-standard FSC of TraR-Eσ70(I). The gold-standard FSC was calculated by comparing the two independently determined half-maps from RELION. The dotted line represents the 0.143 FSC cutoff, which indicates a nominal resolution of 3.7 Å. (H) FSC calculated between the refined structure and the half map used for refinement (work), the other half map (free), and the full map. (I) Gold-standard FSC of TraR-Eσ70(II). The gold-standard FSC was calculated by comparing the two independently determined half-maps from RELION. The dotted line represents the 0.143 FSC cutoff, which indicates a nominal resolution of 3.8 Å. (J) FSC calculated between the refined structure and the half map used for refinement (work), the other half map (free), and the full map.
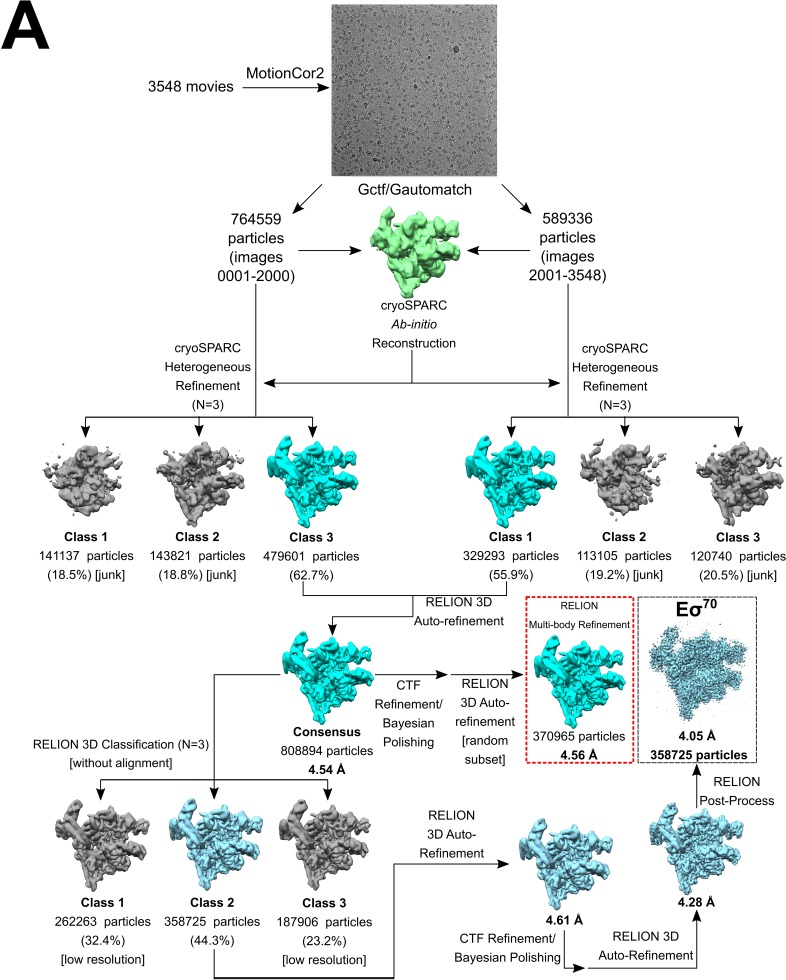
Figure 1—figure supplement 3. Eσ70 cryo-EM processing pipeline.

Figure 1—figure supplement 3.

70 cryo-EM processing pipeline.
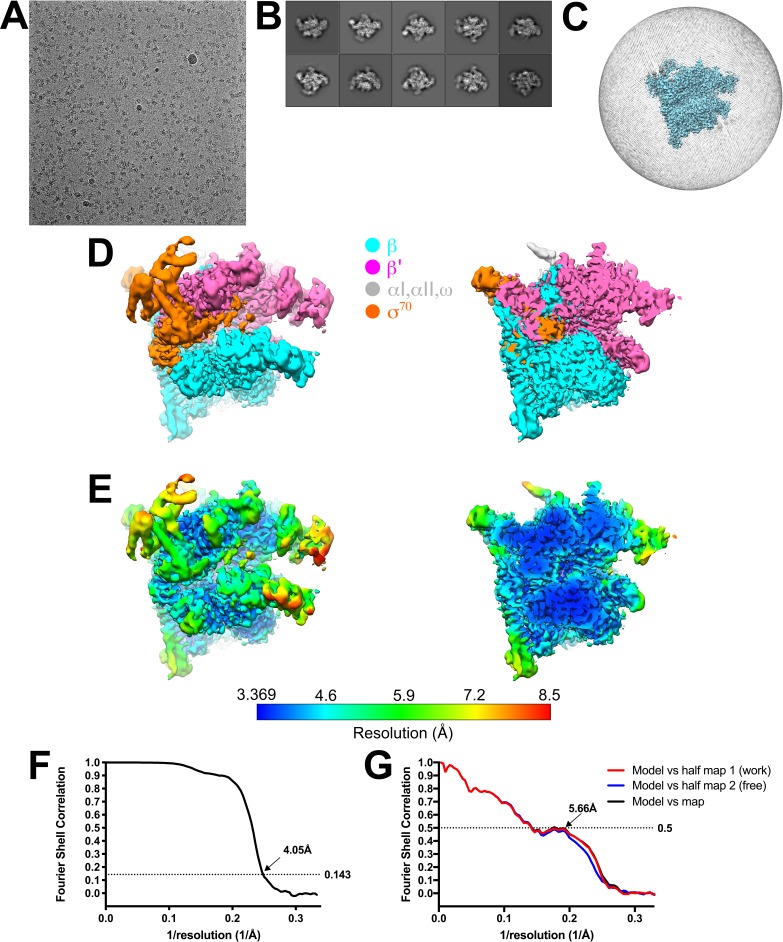
Figure 1—figure supplement 4. Eσ70 cryo-EM.

Figure 1—figure supplement 4.

(A) Representative micrograph of Eσ70 in vitreous ice. (B) The ten most populated classes from 2D classification. (C) Angular distribution for Eσ70 particle projections. (D) The 4.1 Å resolution cryo-EM density map of Eσ70 is colored according to the key. The right view is a cross-section of the left view. (E) Same views as (D) but colored by local resolution (Cardone et al., 2013). (F) Gold-standard FSC of Eσ70. The gold-standard FSC was calculated by comparing the two independently determined half-maps from RELION. The dotted line represents the 0.143 FSC cutoff, which indicates a nominal resolution of 4.1 Å. (G) FSC calculated between the refined structure and the half map used for refinement (work), the other half map (free), and the full map.