. 2020 Jan 20;9:e50770. doi: 10.7554/eLife.50770

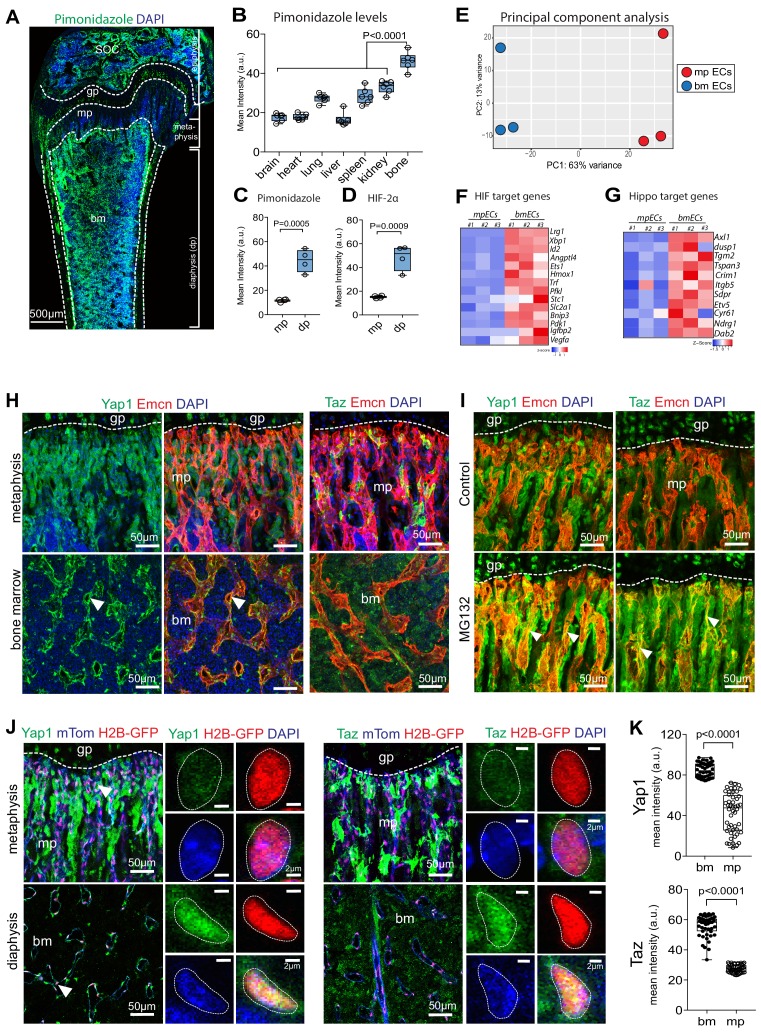
Figure 1. Regional differences in hypoxia and Yap1/Taz expression in bone.

(A) Tile scan maximum intensity projection of P21 femur with Pimonidazole (green) and DAPI (blue) staining. (B) Quantification of Pimonidazole staining intensity (artificial units, a.u.) in different organs. (C, D) Regional differences in Pimonidazole (C) and HIF2α (D) staining levels in metaphysis (mp) and diaphysis (dp). (E) Principal component analysis of RNA sequencing data using most variable genes across the samples. The first principal component (PC1) explains 63% of all variance; and PC2 13% of the variance between metaphyseal (mpECs) and diaphyseal/bone marrow (bmECs) endothelial cells. (F, G) Heat map showing differential expression of hypoxia (F) and Yap1/Taz (G) controlled genes in mpECs vs. bmECs. (H) Confocal image showing immunostaining of Yap1 and Taz (H) in 3-week-old wild-type femur. Arrowheads highlight expression in Emcn+ (red) ECs. Nuclei, DAPI (blue). (I) Immunostaining of Yap1 and Taz in the control (vehicle) and MG132 proteasome inhibitor-treated femoral metaphysis. (J) Nuclear localization (arrowheads) of Yap1 (green) in H2B-GFP+ EC nuclei (shown in red) in 3-week-old Cdh5-mTnG femoral metaphysis (mp) and bone marrow (bm). Higher magnification image shows strong Yap1 and Taz nuclear signals bmECs. (K) Mean intensity (a.u.) of Yap1 and Taz nuclear localization signals in bm and mp ECs. (n = 4; 48 cells in total; data are presented as mean ±sem, P values, two-tailed unpaired t-test).

Figure 1—source data 1. Source data for Figure 1B,C,D,F,G,K.

Figure 1.

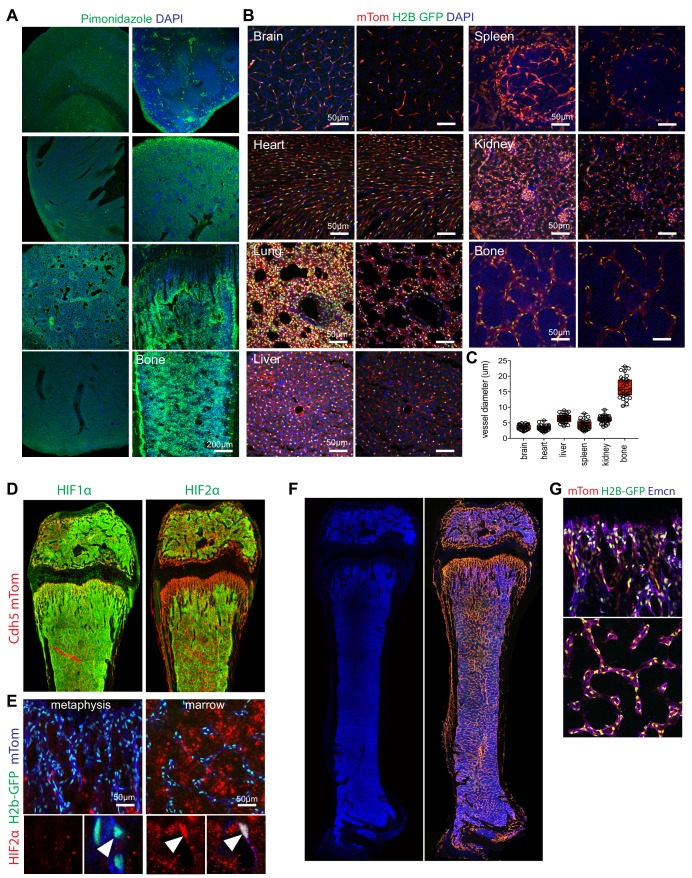
Figure 1—figure supplement 1. Bone-specific features of the vasculature.

Figure 1—figure supplement 1.

(A) Maximum intensity projection of different organ stained with Pimonidazole (green) and DAPI (blue) at P21. (B) Representative confocal images of the vasculature in different organs from 3-week-old Cdh5-mTnG reporter mice (red, mTom; green, H2B-GFP; blue, DAPI). Panels on the left show maximum intensity projections, single focal planes are shown on the right. (C) Quantification of average vessel diameter in different organs (μM). (D, E) Tile scan maximum intensity projections of 3-week-old Cdh5-mTnG femur (red, mTom; green, HIF-1α or HIF-2α, as indicated) (D). Nuclear HIF2α immunosignal (red) is prominent in bone marrow (green, H2B-GFP; blue, mTom) (E). (F, G) Tile scan confocal images of 3-week-old Cdh5-mTnG reporter femur and DAPI (blue). The Cdh5-mTnG reporter labels bmECs and mpECs (F). Higher magnification images show H2B-GFP in endothelial nuclei (G).
Figure 1—figure supplement 1—source data 1. Source data for Figure 1—figure supplement 1C.
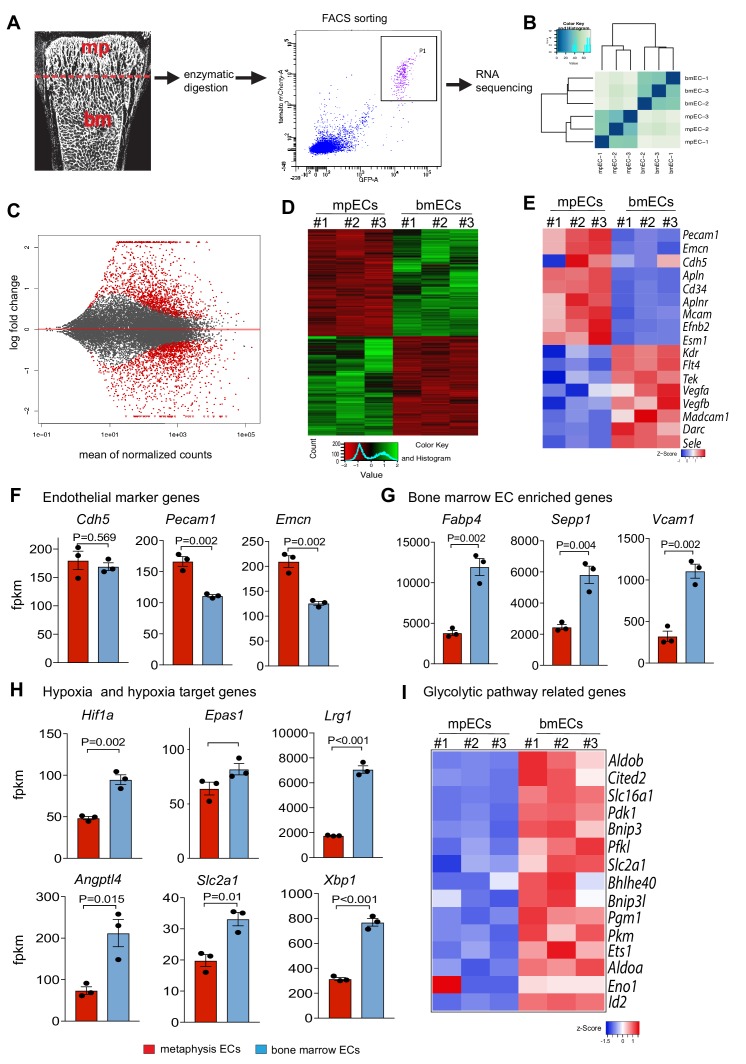
Figure 1—figure supplement 2. Spatial molecular differences between the metaphyseal and BM vasculature.

Figure 1—figure supplement 2.

(A) Experimental strategy for FACS isolation of GFP+ mTom+ mpECs and bmECs from 3-week-old Cdh5-mTnG reporter bones for RNA sequencing. (B) Hierarchical clustering of RNA-seq data of mpECs and bmECs. (C) Differentially regulated genes in MA-plots of P21 mpECs and bmECs. The x-axis represents the mean normalized counts and the y-axis shows the log2 fold change between EC subtypes. Differentially regulated genes are represented by red colored points (FDR-adjusted p-value<0.01 and absolute log2 fold change <1). Data points outside of the range of the y-axis are represented as triangles. (D, E) Heatmap of differentially expressed genes in mpECs and bmECs (D) and differentially expressed endothelial marker genes (E). (F, G) Expression of the endothelial marker genes Pecam1 and Emcn are increased in mpECs, whereas Cdh5 expression is comparable between mpECs and bmECs (F). Fabp4, Sepp1 and Vcam1 are increased in bmECs relative to mpECs (G) (fpkm – fragments per kilobase million; n = 3; data are presented as mean ±sem). (H) Expression of hypoxia inducible factors Hif1a and Epas1 (Hif2a), and the target genes Lrg1, Angptl4, Slc2a1 and Xbp1 are increased in bmECs compared to mpECs (fpkm – fragments per kilobase million; n = 3; data are presented as mean ±sem). (I) Heatmap showing enrichment of glycolytic pathway-related genes in bmECs relative to mpECs.
Figure 1—figure supplement 2—source data 1. Source data for Figure 1—figure supplement 2E,F,G,H and I.
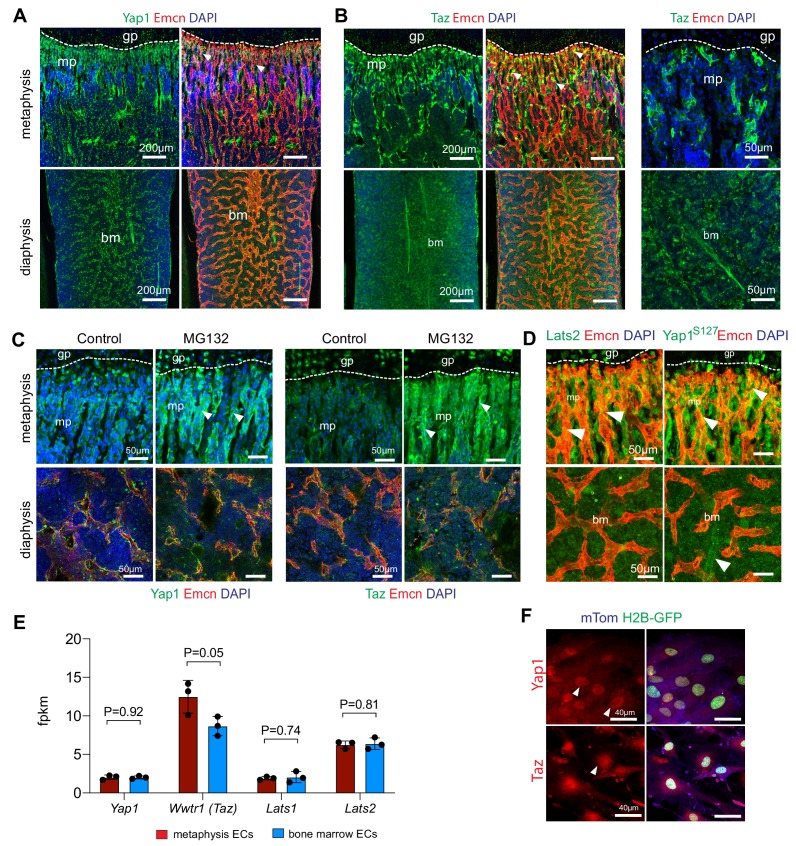
Figure 1—figure supplement 3. Hippo signaling in bone ECs.

Figure 1—figure supplement 3.

(A–B) Confocal images of 3-week-old wild-type femoral sections showing Yap1 (green) (A), Taz (green) (B) immunostaining in the metaphyseal (mp) and bone marrow (bm) Emcn+ (red) vasculature. Nuclei (DAPI (blue). Arrows mark perivascular cells. Growth plate (gp) is indicated. (C) Immunostaining of Yap1 and Taz in control (vehicle) and MG132 proteasome inhibitor-treated femoral metaphysis and diaphysis. (D) Enhanced immunostaining of Lats2 and phospho-Yap1S127 in the metaphysis (mp) relative to bone marrow (bm). (E) RNA-seq data showing expression of the Yap1, Taz (Wwtr1), Lats1 and Lats2 in mpECs and bmECs (n = 3; data are presented as mean ±sem). (F) In vitro culture of bone ECs from Cdh5-mTnG reporter mice. Yap1 and Taz immunostaining is concentrated in nuclei.
Figure 1—figure supplement 3—source data 1. Source data for Figure 1—figure supplement 3E.