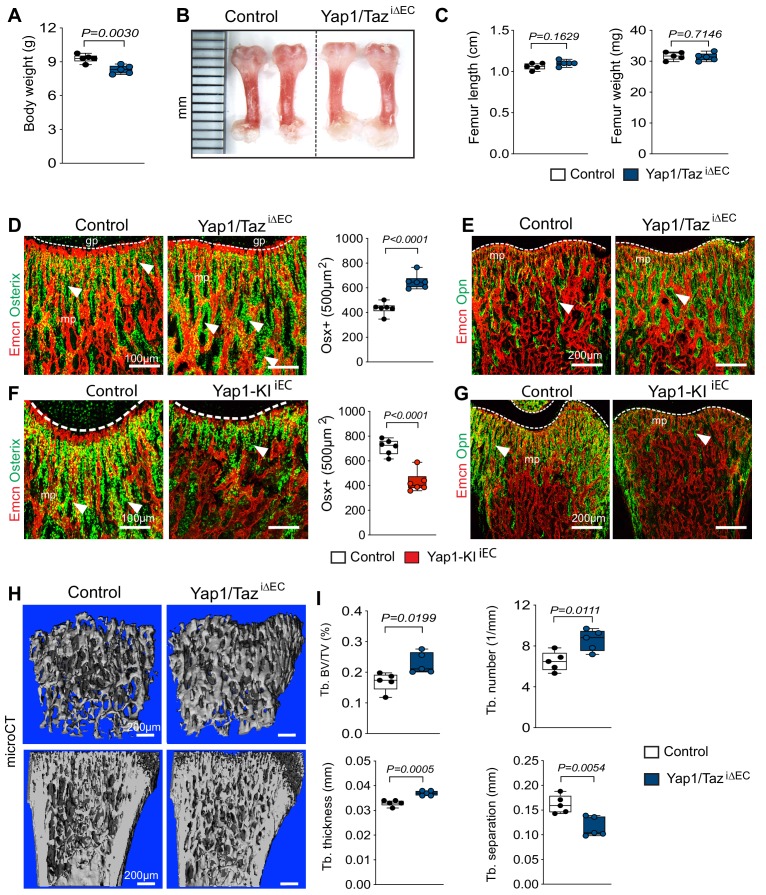
Figure 7. Endothelial Hippo signaling promotes coupling of angiogenesis and osteogenesis.
(A) Average body weight of P21 control and Yap1/TaziΔEC mutants (n = 6; data are presented as mean ±sem, P values, two-tailed unpaired t-test). (B, C) Representative images of P21 control and Yap1/TaziΔEC femur (C). Quantitation of femur length and weight show no changes between Yap1/TaziΔEC mutants and littermate controls (C) (n = 6; data are presented as mean ±sem, P values, two-tailed unpaired t-test). (D) Confocal images showing Osterix+ cells (green) in relation to Emcn+ ECs (red) in P21 Yap1/TaziΔEC and control metaphysis. Graph on the right shows quantitative analysis of Osterix+ (Osx+) cells (control n = 6 and Yap1/TaziΔECn = 6; data are presented as mean ±sem, P values, two-tailed unpaired t-test). (E) Confocal images showing bone vessels (Emcn), and the bone matrix protein Osteopontin in Yap1/TaziΔEC vs control femur. (F) Representative confocal images of Osterix+ cells (green) in relation to Emcn+ ECs (red) in the P21 control and Yap1-KIiEC femoral metaphysis. Graph on the right shows significant reduction of Osterix+ cells in Yap1-KIiEC mutants (n = 6; data are presented as mean ±sem, P values, two-tailed unpaired t-test). (G) Decreased bone matrix protein Osteopontin (Opn, green) deposition in P21 Yap1-KIiEC femur relative to control. ECs, Emcn (red). (H, I) Representative μCT images of trabecular bone in P21 control and Yap1/TaziΔEC femur (H). Quantitative analysis of trabecular volume (BV/TV, bone volume/total volume) trabecular (Tb.) number, Tb. thickness, and Tb. separation (I). (n = 5; data are presented as mean ±sem, P values, two-tailed unpaired t-test).


